Quantcast
Channel: Andrew Lock | .NET Escapades
Viewing all 743 articles
Browse latest View live

Controlling IHostedService execution order in ASP.NET Core 3.x

$
0
0
Controlling IHostedService execution order in ASP.NET Core 3.x

ASP.NET Core 3.0 re-platformed the WebHostBuilder on top of the generic IHost abstraction, so that Kestrel runs in an IHostedService. Any IHostedService implementations you add to Startup.ConfigureServices() are started before the GenericWebHostService that runs Kestrel. But what if you need to start your IHostedService after the middleware pipeline has been created, and your application is handling requests?

In this post I show how to add an IHostedService to your application so that it runs after the GenericWebHostSevice. This only applies to ASP.NET Core 3.0+, which uses the generic web host, not to ASP.NET Core 2.x and below.

tl;dr; As described in the documentation, you can ensure your IHostedService runs after the GenericWebHostSevice by adding an additional ConfigureServices() to the IHostBuilder in Program.cs, after ConfigureWebHostDefaults().

The generic IHost starts your IHostedServices first

I've discussed the ASP.NET Core 3.x startup process in detail in a previous post, so I won't cover it again here other than to repeat the following image:
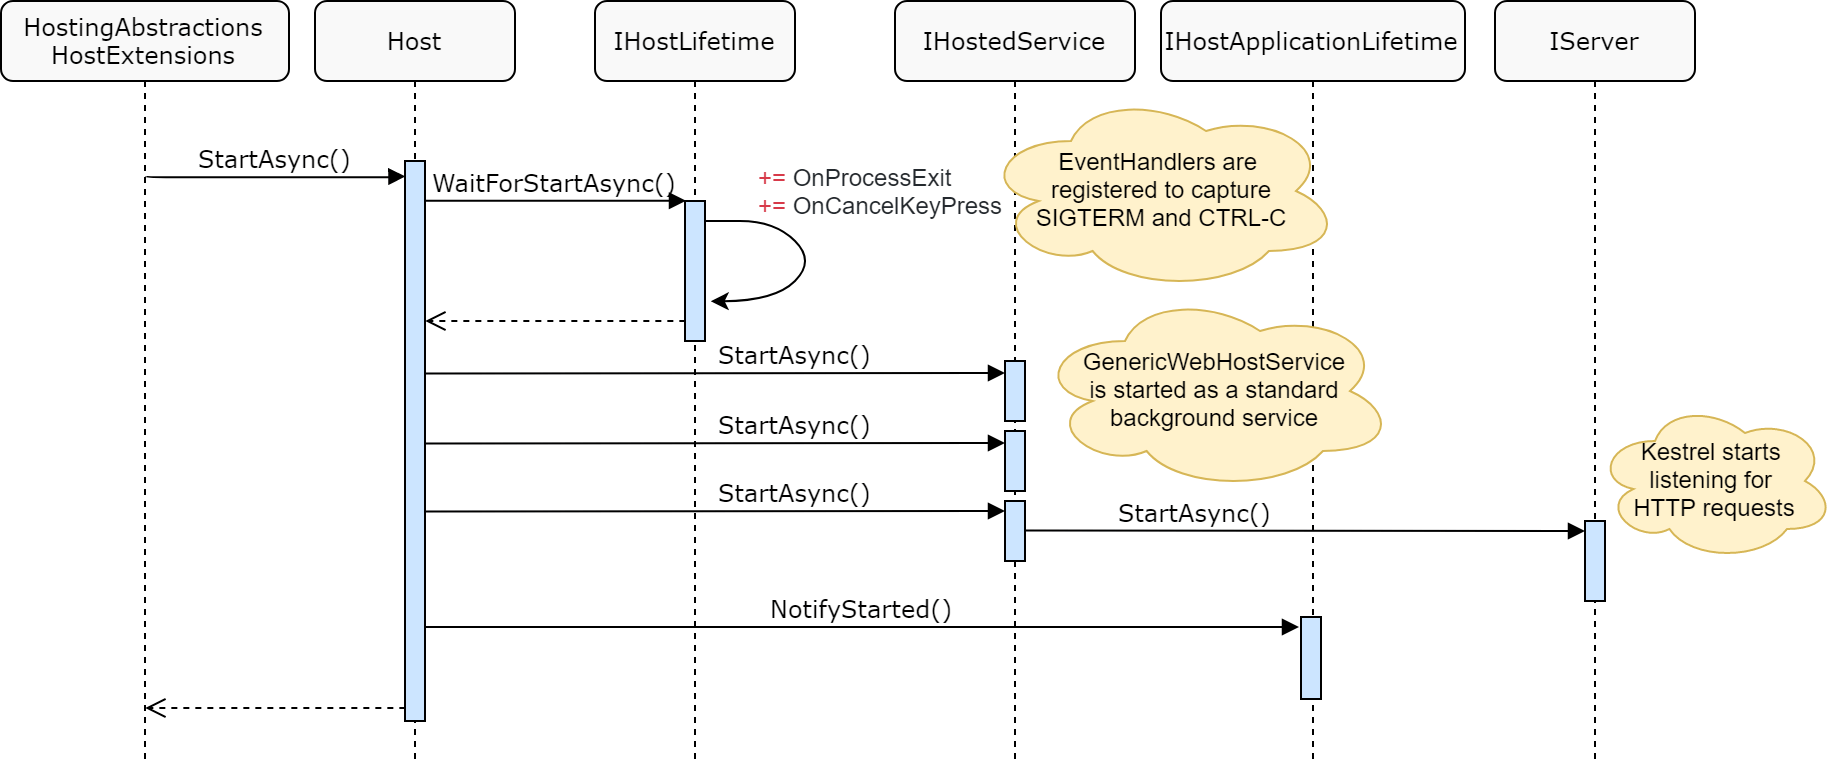
Sequence diagram for Host.StartAsync()

This shows the startup sequence when you call RunAsync() on IHost (which in turn calls StartAsync()). The important parts for our purposes are the IHostedServices that are started As you can see from the above diagram, your custom IHostedServices are started before the GenericWebHostSevice that starts the IServer (Kestrel) and starts handling requests.

You can see an example of this by creating a very basic IHostedServer implementation:

public class StartupHostedService : IHostedService
{
    private readonly ILogger _logger;
    public StartupHostedService(ILogger<StartupHostedService> logger)
    {
        _logger = logger;
    }

    public Task StartAsync(CancellationToken cancellationToken)
    {
        _logger.LogInformation("Starting IHostedService registered in Startup");
        return Task.CompletedTask;
    }

    public Task StopAsync(CancellationToken cancellationToken)
    {
        _logger.LogInformation("StoppingIHostedService registered in Startup");
        return Task.CompletedTask;
    }
}

And add it to Startup.cs:

public class Startup
{
    public void ConfigureServices(IServiceCollection services)
    {
        services.AddHostedService<StartupHostedService>();
    }
}

When you run your application, you'll see your IHostedService write its logs before Kestrel runs it's configuration, and logs the ports it's listening on:

info: HostedServiceOrder.StartupHostedService[0]     # Our IHostedService
      Starting IHostedService registered in Startup
info: Microsoft.Hosting.Lifetime[0]                  # The GenericWebHostSevice
      Now listening on: http://localhost:5000
info: Microsoft.Hosting.Lifetime[0]
      Application started. Press Ctrl+C to shut down.

As expected, our IHostedService executes first, followed by the GenericWebHostSevice. The ApplicationLifetime event fires after all the IHostedServices have executed. No matter where you register your IHostedService in Startup.ConfigureServices(), the GenericWebHostSevice will always fire last.

Why does GenericWebHostSevice execute last?

The order that IHostedServices are executed depends on the order that they're added to the DI container in Startup.ConfigureServices(). For example, if you register two services in Startup.cs, Service1 and Service2:

public class Startup
{
    public void ConfigureServices(IServiceCollection services)
    {
        services.AddHostedService<Service1>();
        services.AddHostedService<Service2>();
    }
}

then they'll be executed in that order on startup:

info: HostedServiceOrder.Service1[0]            # Registered first
      Starting Service1
info: HostedServiceOrder.Service2[0]            # Registered last
      Starting Service2
info: Microsoft.Hosting.Lifetime[0]             # The GenericWebHostSevice
      Now listening on: http://localhost:5000

The GenericWebHostSevice is registered after the services in Startup.ConfigureServices(), when you call ConfigureWebHostDefaults() in Program.cs:

public class Program
{
    public static void Main(string[] args)
        => CreateHostBuilder(args).Build().Run();

    public static IHostBuilder CreateHostBuilder(string[] args) =>
        Host.CreateDefaultBuilder(args)
            .ConfigureWebHostDefaults(webBuilder =>      // The GenericWebHostSevice is registered here
            {
                webBuilder.UseStartup<Startup>();
            });
}

The ConfigureWebHostDefaults extension method calls the ConfigureWebHost method, which executes Startup.ConfigureServices() and then registers the GenericWebHostService.

public static IHostBuilder ConfigureWebHost(this IHostBuilder builder, Action<IWebHostBuilder> configure)
{
    var webhostBuilder = new GenericWebHostBuilder(builder);

    // This calls the lambda function in Program.cs, and registers your services using Startup.cs
    configure(webhostBuilder); 

    // Adds the GenericWebHostService
    builder.ConfigureServices((context, services) => services.AddHostedService<GenericWebHostService>());
    return builder;
}

This approach was taken to ensure that the GenericWebHostService always runs last, to keep behaviour consistent between the generic Host implementation and the (now deprecated) WebHost implementation.

However, if you need to run an IHostedService after GenericWebHostService, there's a way!

Registering IHostedServices in Program.cs

In most cases, starting your IHostedServices before the GenericWebHostService is the behaviour you want. However, the GenericWebHostService is also responsible for building the middleware pipeline of your application. If your IHostedService relies on the middleware pipeline or routing, then you may need to delay it starting until after the GenericWebHostService.

A good example of this would be the "duplicate route detector" I described in a previous post. This relies on the routing tables that are constructed when the middleware pipeline is built.

The only way to have your IHostedService executed after the GenericWebHostService is to add it to the DI container after the GenericWebHostService. That means you have to step outside the familiar Startup.ConfigureServices(), and instead call ConfigureServices() directly on the IHostBuilder, after the call to ConfigureWebHostDefaults:

public class Program
{
    public static void Main(string[] args)
        => CreateHostBuilder(args).Build().Run();

    public static IHostBuilder CreateHostBuilder(string[] args) =>
        Host.CreateDefaultBuilder(args)
            .ConfigureWebHostDefaults(webBuilder => // The GenericWebHostSevice is registered here
            {
                webBuilder.UseStartup<Startup>();
            })
            // Register your HostedService AFTER ConfigureWebHostDefaults
            .ConfigureServices(
                services => services.AddHostedService<ProgramHostedService>());
}

There's nothing special about the ConfigureServices() methods on IHostBuilder, so you could do all your DI configuration in these extensions if you wanted - that's how worker services do it after all!

Now if you run your application, you'll see that the "startup" IHostedService runs first, followed by the GenericWebHostSevice, and finally the "program" IHostedService:

info: HostedServiceOrder.StartupHostedService[0]         # Registered in Startup.cs
      Starting IHostedService registered in Startup
info: Microsoft.Hosting.Lifetime[0]                      # Registered by ConfigureWebHostDefaults
      Now listening on: http://localhost:5000
info: HostedServiceOrder.ProgramHostedService[0]         # Registered in Program.cs
      Starting IHostedService registered in Program.cs
info: Microsoft.Hosting.Lifetime[0]
      Application started. Press Ctrl+C to shut down.

When you shut down your application, the IHostedServices are stopped in reverse, so the "program" IHostedService stops first, followed by the GenericWebHostSevice, and finally the "startup" IHostedService:

info: Microsoft.Hosting.Lifetime[0]
      Application is shutting down...
info: HostedServiceOrder.ProgramHostedService[0]
      StoppingIHostedService registered in Program.cs
# The GenericWebHostSevice doesn't write any logs when shutting down...
info: HostedServiceOrder.StartupHostedService[0]
      StoppingIHostedService registered in Startup

That's all there is to it!

Summary

IHostedServices are executed in the same order as they're added to the DI container in Startup.ConfigureServices(). The GenericWebHostSevice which runs the Kestrel server that listens for HTTP requests always runs after any IHostedServices you register here.

To start an IHostedService after the GenericWebHostSevice, use the ConfigureServices() extension methods on IHostBuilder in Program.cs. Ensure you add the ConfigureServices() call after the call to ConfigureWebHostDefaults(), so that your IHostedService is added to the DI container after the GenericWebHostSevice.

Should you unit-test API/MVC controllers in ASP.NET Core?

$
0
0
Should you unit-test API/MVC controllers in ASP.NET Core?

Based on Betteridge's law of headlines: no!

But based on recent twitter activity, that's no doubt a somewhat controversial opinion, so in this post I look at what a unit-test for an API controller might look like, what a unit-test is trying to achieve, and why I think integration tests in ASP.NET Core give you far more bang-for-your-buck.

I start by presenting my thesis, about why I don't find unit tests of controllers very useful, acknowledging the various ways controllers are used in ASP.NET Core. I'll then present a very simple (but representative) example of an API controller, and discuss the unit tests you might write for that class, the complexities of doing so, as well as the things you lose by testing the controller outside the ASP.NET Core MVC framework as a whole.

This post is not trying to suggest that unit tests are bad in general, or that you should always use integration tests. I'm only talking about API/MVC controllers here.

Where does the logic go for an API/MVC controller?

The MVC/API controllers people write generally fall somewhere on a spectrum:

  • Thick controllers—The action method contains all the logic for implementing the behaviour. The MVC controller likely has additional services injected in the constructor, and the controller takes care of everything. This is the sort of code you often see in code examples online. You know the sort—where an EF Core DbContext, or IService is injected and manipulated in the action method body:
public class BlogPostController : Controller
{
    // Often this would actually be an EF Core DB Context injected in constructor!
    private readonly IRepository _repository;
    public BlogPostController(IRepository repository) => _repository = repository;

    [HttpPost]
    public ActionResult<Post> Create(InputModel input)
    {
        if(!ModelState.IsValid)
        {
            return BadRequest(ModelState);
        }

        // Some "business logic" 
        if(_repository.IsSlugAvailable(input.Slug)
        {
            ModelState.AddError("Slug", "Slug is already in use");
            return BadRequest(ModelState);
        }

        var model = new BlogPost
        {
            Id = model.Id,
            Name = model.Name,
            Body = model.Body,
            Slug = model.Slug
        });
        _repository.Add(model);

        return result;
    }
}
  • Thin controllers—The action method delegates all the work to a separate service. In this case, most of the work is done in a separate handler, often used in conjunction with a library like Mediatr. The action method becomes a simple mapper between HTTP-based models/requests/responses, and domain-based models/commands/querys/results. Steve Smith's API endpoints project is a good example that is pushing this approach.
public class BlogPostController : BaseApiController
{
    [HttpPost]
    public async Task<IActionResult> Create([FromBody]NewPostCommand command)
    {
        var result = await Mediator.Send(command);
        return Ok(result);
    }
}

So which approach do I use? Well, as always it depends. In general, I think the second option is clearly the more scalable, manageable, and testable option, especially when used in conjunction with conventions or libraries that enforce that practice.

But sometimes, I write the other types of controllers. Sometimes it's because I'm being sloppy. Sometimes it's because I need to do some HTTP related manipulation which wouldn't make sense to do in a command handler. Sometimes the action is so simple it just doesn't warrant the extra level of indirection.

What I don't do (any more 🤦‍♂️), is put important domain logic in action methods. Why? Because it makes it harder to test.

"But you can unit-test controllers!" I hear you cry. Well…yes…but…

What don't you test in controller unit tests

MVC/API controllers are classes, and actions are just methods, so you can create and invoke them in unit tests the same way you would any other system under test (SUT).

The trouble is, in practice, controllers do most of their useful work as part of a framework, not in isolation. In unit tests, you (intentionally) don't get any of that.

In this section I highlight some of the aspects of MVC controllers that you can't easily test or wouldn't want to test in a unit test.

Routing

This is one of the most important roles of a controller: to serve as a handler for a given incoming route. Unit tests ignore that aspect.

You could certainly argue that's OK for unit tests—routing is a separate concern to the handling of a method. I can buy that, but routing is such a big part of what a controller is for, it feels like it's missing the point slightly.

Technically, it is possible to do some testing of the routing infrastructure for your app, as I showed in a previous post. I think you could argue both ways as to whether that's an integration test or a unit test, but the main point is it's pretty hard work!

Model Binding

When handling a request, the MVC framework "binds" the incoming request to a series of C# models. That all happens outside the controller, so won't be exercised by unit tests. The arguments you pass to a controller's action method in a unit test are the output of the model binding step.

Again, we're talking about unit tests of controllers, but model binding is a key part of the controller in practice, and likely won't be unit tested separately. You could have a method argument that's impossible to bind to a request, and unit tests won't identify that. Effectively, you may be calling your controller method with values that cannot be generated in practice.

For the simple, contrived, example model below, you'll get an exception at runtime when model binding tries to create an InputModel instance, as there's no default constructor.

public class InputModel
{
    public string Slug { get; }

    public InputModel(string slug)
    {
        Slug = slug;
    }
}

Granted, a mistake like that, using read-only properties, is very unlikely in practice. But there are also pretty common mistakes like typos in property names that mean model binding would fail. Those won't be picked up in unit tests, where strong typing means you just set the property directly.
Again, I'm not arguing that a unit test of a controller should catch these things, just pointing out how many implicit dependencies on the framework that MVC controllers have.

Model validation

The above example is contrived, but it highlights another important point. The validation of input arguments and enforcing constraints is an important part of most C# methods, but not action methods.

Validation occurs outside the controller, as part of the MVC framework. The framework communicates validation failures by setting values on the ModelState property. Controllers should typically check the ModelState property before doing anything.

In some ways, this is good. Validation is moved outside the action method, so you can test it independently of the controller action method. Whether you're using DataAnnotation attributes, of FluentValidation, you can ensure the models you're receiving are valid, and you can test those validation rules separately.

It feels a little strange in unit tests though, where passing in an "invalid" model, won't cause your action method to take the "sad" path, unless you explicitly match the ModelState property to the model.

For example if you have the following model:

public class InputModel
{
    [Required]
    public string Slug { get; set; }
}

and you want to test the "sad" path of the "thick" controller shown previously, then you have to make sure to set the ModelState:

[Fact]
public void InvalidModelTest()
{

    // Arrange
    var model = new InputModel{ Slug = "" }; // Invalid model
    var controller = new BlogPostController();

    // Have to explictly add this
    controller.ModelState.AddModelError("Slug", "Required");

    // Act
    var result = await controller.Create(model);

    // Assert etc
}

Again, this isn't necessarily a deal-breaker, but it's extra coupling. If you want to test your controller with "real" inputs, you have to ensure you keep the ModelState in sync with the method arguments, which means you need to keep it in-sync with the validation requirements of your model. If you don't, the behaviour of your controller in practice becomes undefined, or at least, untested.

Filter Pipeline

An exception to the previous validation example might be API controllers that are using the [ApiController] attribute. Requests to these controllers are automatically validated, and a 400 is sent back as part of the MVC filter pipeline for invalid requests. That means an API controller should only be called with valid models.

That helps with unit testing controllers, as it's an aspect your controller can ignore. No need to try and match the incoming model with the ModelState, as you know you should only have to handle valid models. When filters are used like this, to extract common logic, they make controllers easier to test.

But the filter pipeline isn't only used to extract functionality from controllers. It's sometimes used to provide values to your controllers. For example, think of a filter in a multi-tenant environment that sets common values for the tenant on the HttpContext. If you use filters like this, that's something else you're going to have to take into account in your controller unit tests.

Surely noone would do that, right? The extra coupling it adds seems obvious. Maybe… but that's essentially how authentication works (though using middleware, rather than a filter).

Still filters aren't used that often in my experience, except for the [Authorize] attribute of course.

Authorization

If you apply authorization policies declaratively using the [Authorize] attribute, then they'll have no effect on the controller unit tests. That's a good thing really, it's a separate concern. You can test your authorization policies and handlers separately from your controllers.

Except if you have resource-based, imperative, authorization checks in your controller. These are very common in multi-user environments—I shouldn't be able to edit a post that you authored, for example. Resource-based authorization uses the IAuthorizationService interface which you need to inject into your controller. You can mock this dependency pretty easily using a mocking framework, but it's just one more thing to have to deal with.

Each of these aspects on their own are pretty small, and easy to wave off as "not a big deal", but for me they just move the needle for how worthwhile it is to test your controllers.

So, what are you trying to test?

This is the crux of the matter for me— what are you trying to test by unit-testing MVC/API controllers? The answer will likely depend what "type" of controller you're trying to test.

Testing "thick" controllers

If you're testing the first type of controller, where the action method contains all the business logic for the action, then you're going to struggle. These controllers are doing everything, so the "unit" here is really too large to easily test. You're likely going to have to rely on mocking lots of services, which increases the complexity of tests, while generally reducing their efficacy.

Even ignoring all that, what are you trying to test. For the Create() method, are you going to test that _repository.Add() is called on a stub/mock of the IRepository? Interaction-based tests like these are generally pretty fragile, as they're often specific to the internal implementation of the method. State-based tests are generally a better option, though even those have issues with action methods, as you'll see shortly.

Testing "thin" controllers

Thin controllers are basically just orchestrators. They provide a handler and hooks for interacting with ASP.NET Core, but they delegate the "real" work to a separate handler, independent of ASP.NET Core.

With this approach, you can more-easily unit test your "domain" services, as that work is not happening in the controller. Instead, unit tests of the controller would effectively be testing that any pre-condition checks run correctly, that input models are mapped correctly to "domain service" requests, and that "domain service" responses are mapped correctly to HTTP responses.

But as we've already discussed, most of that doesn't happen in the controller itself. So testing the controller becomes redundant, especially as all your controllers start to look pretty much the same.

Let's just try a unit test

I've ranted a lot in this post, but it's time to write some code. This code is loosely based on the examples of unit testing controllers in the official documentation, but it suffers from a lot of the points I've already covered.

These examples only deal with testing the "thick" controller scenarios, as in the documentation.

In the "thick" controller example from the start of this post, I injected a single service _repository for simplicity, but often you'll see multiple services injected, as well as concrete types (like EF Core's DbContext). The more complicated the method gets, and the more dependencies it has, the harder the action is to "unit" test.

I guess a "unit" test for this controller should verify that if a slug has already been used, you should get a BadRequest result, something like this (for example using the Moq library):

[Fact]
public async Task Create_WhenSlugIsInUse_ReturnsBadRequest()
{
    // Arrange
    string slug = "Some Slug";
    var mockRepo = new Mock<IRepository>();
    mockRepo.Setup(repo => repo.IsSlugAvailable(slug)).Returns(false);
    var controller = new BlogPostController(mockRepo.Object);
    var model = new InputModel{ Slug = slug}

    // Act
    ActionResult<Post> result = controller.Create(model);

    // Assert
    Assert.IsType<BadRequestObjectResult>(result.Result);
}

This test has some value—it tests that calling Create() with a Slug that already exists returns a bad request. There's a bit of ceremony around creating the mock object, but it could be worse. The need to call result.Result to get the IActionResult is slightly odd, but I'll come to that shortly.

Lets look at the happy case, where we create a new post:

[Fact]
public async Task Create_WhenSlugIsNotInUse_ReturnsNewPost()
{
    // Arrange
    string slug = "Some Slug";
    var mockRepo = new Mock<IRepository>();
    mockRepo.Setup(repo => repo.IsSlugAvailable(slug)).Returns(true);
    var controller = new BlogPostController(mockRepo.Object);
    var model = new InputModel{ Slug = slug}

    // Act
    ActionResult<Post> result = controller.Create(model);

    // Assert
    Post createdPost = result.Value;
    Assert.Equal(createdPost.Slug, slug);
}

We still have the mock configuration ceremony, but now we're using result.Value to get the Post result. That Result/Value discrepancy is annoying…

ActionResult<T> and refactorability.

ActionResult<T> was introduced in .NET Core 2.1. It uses some clever implicit conversion tricks to allow you to return both an IActionResult or an instance of T from your action methods. Which means the following code compiles:

public class BlogPostController : Controller
{
    [HttpPost]
    public ActionResult<Post> Create(InputModel input)
    {
        if(!ModelState.IsValid)
        {
            return BadRequest(ModelState); // returns IActionResult
        }

        return new Post(); // returns T
    }
}

This is very handy for writing controllers, but it makes testing them a bit more cumbersome. With the example above, the following test would pass:

// Arrange
var controller = new BlogPostController()
var model = new InputModel()

// Act
ActionResult<Post> result = controller.Create();

// Assert
Post createdPost = result.Value;
Assert.NotNull(createdPost);

But if we change the last line of our controller to the semantically-identical version:

return Ok(new Post()); // returns OkObjectResult() of T

Then our test fails. The behaviour of the controller is identical in the context of the framework, but we have to update our tests:

// Act
ActionResult<Post> result = controller.Create();

// Assert
OkObjectResult objectResult = Assert.IsType<OkObjectResult>(result.Result);
Post createdPost = Assert.IsType<Post>(objectResult.Value);
Assert.NotNull(createdPost);

Yuk. There are things you can do to try and reduce this brittleness (such as relying on IConvertActionResult) but I just don't know that it's worth the effort.

Testing other aspects

This post is already way too long, so I'm not going to dwell on other difficulties. Here are a few highlights instead:

So what's the alternative?

Integration tests are often simpler, avoid that complexity and test more

In my experience, writing "integration" tests in ASP.NET Core are for controllers is far more valuable than trying to unit test them, and is easier than ever in ASP.NET Core.

Steve Gordon has a new Pluralsight course that describes a best-practices for integration testing your ASP.NET Core applications.

The in-memory TestServer available in the Microsoft.AspNetCore.TestHost package lets you create small, focused, "integration" tests for testing custom middleware. These are "integration" in the sense that they're executed in the context of a "dummy" ASP.NET Core application, but are still small, fast, and focused.

At the other end, the WebApplicationFactory<T> in the Microsoft.AspNetCore.Mvc.Testing package lets you test things in the context of your real application. You can still add stub services for the database (for example) if you want to keep everything completely in-memory.

On top of that, the rise of Docker has made using your real database for integration tests far more achievable. A few good end-to-end integration tests can really give you confidence that the overall "plumbing" in your application is correct, and that the happy path, at the very least, is working. And I'm not the only one who thinks like that:

Again, saying that integration tests are more valuable for testing "heavily integrated" components like controllers is not saying you shouldn't unit test. Unit tests should absolutely be used where they add value. Just don't try and force them everywhere for the sake of it.

Summary

I don't find unit testing MVC/API controllers very useful. I find they require a lot of ceremony, are often brittle using many mocks and stubs, and often don't actually catch any errors. I think integration tests (coupled with unit tests of your domain logic) adds far more value, with few trade-offs in most cases.

An Introduction to Kubernetes: Deploying ASP.NET Core applications to Kubernetes - Part 1

$
0
0
An Introduction to Kubernetes

This post is the first in a series on deploying ASP.NET Core applications to Kubernetes. In this series I'll cover a variety of topics and things I've learned in deploying applications to Kubernetes. I'm not an expert on Kubernetes by any means, so I'm not going to go deep into a lot of the technical aspects, or describe setting up a Kubernetes cluster. Instead I'm going to focus on the app-developer's side, taking an application and deploying it to an existing cluster.

Important note: I started writing this blog series about a year ago, but it's been delayed for various reasons (ahem, procrastination). Since then Project Tye has arisen as a promising new way to deploy ASP.NET Core apps to Kubernetes. I won't touch on Project Tye in this series, though I'm sure I'll blog about it soon!

This series does not focus on using Docker with ASP.NET Core in general. Steve Gordon has an excellent blog series on Docker for .NET developers, as well as multiple talks and videos on the subject. I also have many other posts on my blog about using Docker with ASP.NET Core. Scott Hanselman has also a recent 101 introduction to containers. Note that although production-level support for Windows has been around for a while I'm only going to be considering Linux hosts for this series.

Another important point is that I don't consider myself a Kubernetes expert by any means! The approaches I describe in this series are very much taken from my own experience of deploying ASP.NET Core applications to a Kubernetes cluster. If there's anything that you don't agree with or looks incorrect, please do let me know in the comments! 🙂

In this post I describe some of the fundamental concepts that you'll need to be familiar with to deploy ASP.NET Core applications to Kubernetes.

What is Kubernetes and do I need it?

Kubernetes is an open-source platform for orchestrating containers (typically Docker containers). It manages the lifecycle and networking of containers that are scheduled to run, so you don't have to worry if your app crashes or becomes unresponsive - Kubernetes will automatically tear it down and start a new container.

The question of whether you need to use Kubernetes is an interesting one. There definitely seems to be a push towards it from all angles these days, but you have to realise it adds a lot of complexity. If you're building a monolithic app, Kubernetes is unlikely to bring you value. Even if you're heading towards smaller services, it's not necessary to immediately jump on the band wagon. The question is: is service orchestration (the lifetime management and connection between multiple containers) currently a problem for you, or is it likely to be soon? If the answer is yes, then Kubernetes might be a good call. If not, then it probably isn't.

How much do I need to learn?

Having a deep knowledge of the concepts and features underlying Kubernetes will no doubt help you diagnose any deployment or production issues faster. But Kubernetes is a large, fast moving platform, so it can be very overwhelming! One of the key strengths of Kubernetes - its flexibility - is also one of the things that I think makes it hard to grasp.

For example, the networking stack is pluggable, so you can swap in and out network policy managers. Personally I find networking to be a nightmare to understand at the best of times, so having it vary cluster-to-cluster makes it a minefield!

The good news is that if you're only interested in deploying your applications, then the cognitive overhead drops dramatically. That's the focus of this series, so I'm not going to worry about kubelets, or the kube-apiserver, and other such things. If you already know about them or want to read up, great, but they're not necessary for this series.

Also, it might well be worth looking at the platform offerings for Kubernetes from Azure, AWS, or Google. These provide managed installations of Kubernetes, so if you are having to dive deeper into Kubernetes, you might find they simplify many things, especially getting up and running.

The basic Kubernetes components for developers

Instead of describing the multitude of pieces that make up a Kubernetes cluster, I'm going to describe just five concepts:

I'm not going to be deeply technical, I'm just trying to lay the framework for later posts 🙂

Nodes

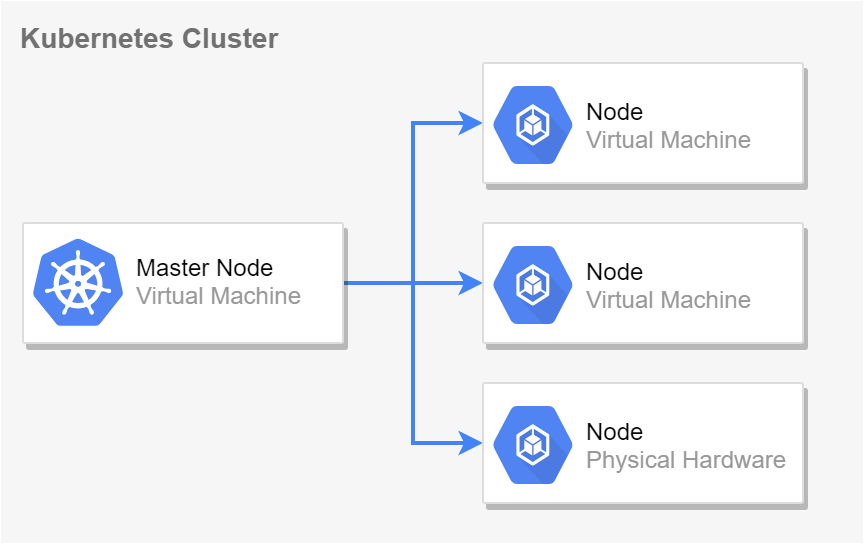
Nodes in a Kubernetes cluster are Virtual Machines or physical hardware. It's where Kubernetes actually runs your containers. There are typically 2 types of Node

  • The master node, which contains all the "control plane" services required to run a cluster. Typically the master node only handles this management access, and doesn't run any of your containerised app workloads.
  • Other nodes, which are used to run your applications. A single node can run many containers, depending on the resource constraints (memory, CPU etc) of the node.
Multiple VMs/Nodes forming a cluster
A Kubernetes Cluster consists of a master node, and optionally additional nodes

The reality is less clearly segregated, but if you're not managing the cluster, it's probably not something you need to worry about. Note that if you're running a Kubernetes cluster locally for development purposes it's common to have a single Node (your machine or a VM) which is a master node that has been "tainted" to also run containers.

As it looks pretty cool, I have to point out there's also an Azure service for creating "virtual nodes" which allows you to spin up Container Instances dynamically as load increases. Worth checking out if you're using Azure's managed Kubernetes service. AWS has a similar service, Fargate, which should make scaling clusters easier.

tl;dr; Nodes are VMs that run your app. The more Nodes you have, the more containers you can run and (potentially) more fault tolerant you are if one Node goes down.

Pods

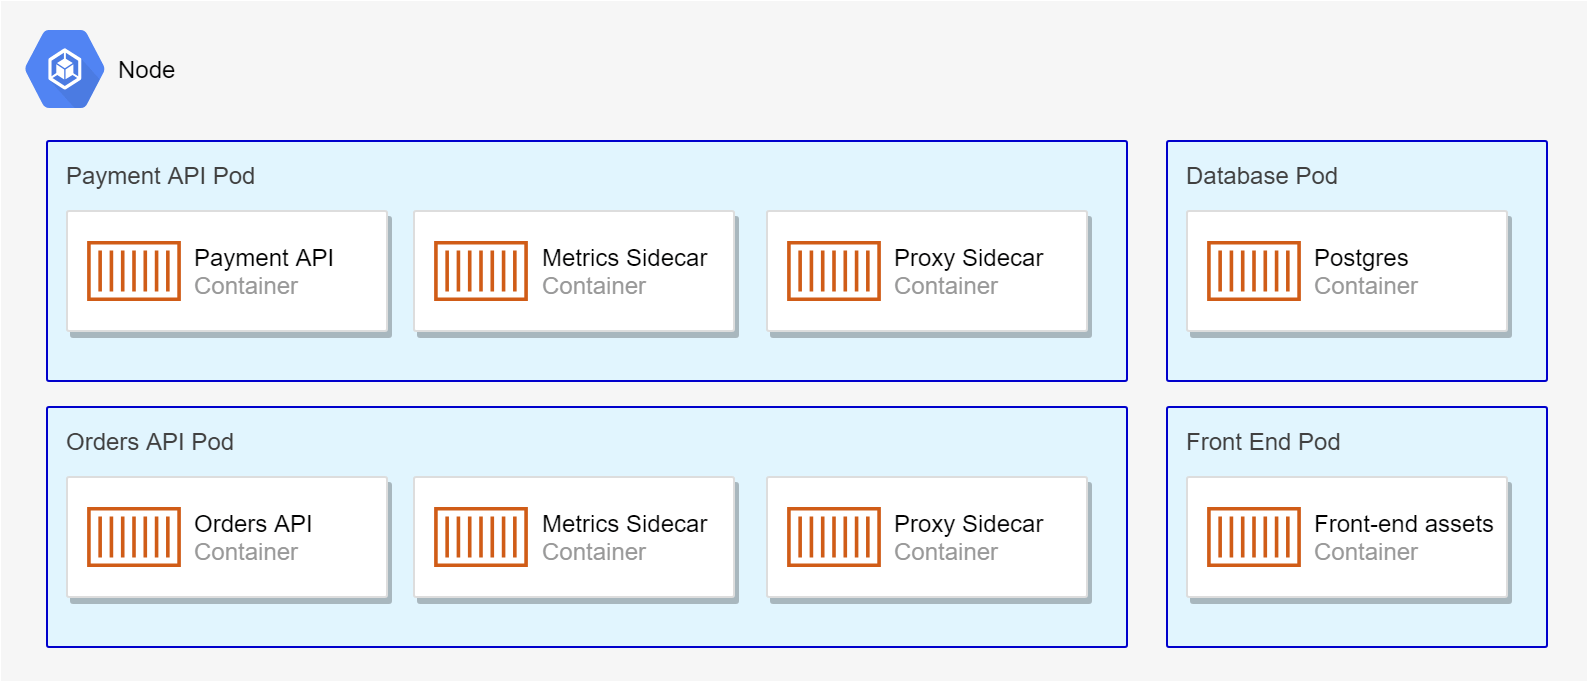
To run your application in Kubernetes, you package it into a container (typically a Docker container) and ask Kubernetes to run it. A pod is the smallest unit that you can ask Kubernetes to run. It contains one or more containers. When a pod is deployed or killed, all of the containers inside it are started or killed together.

Side note: the name "pod" comes from the collective noun for a group of whales, so think of a pod as a collection of your Docker (whale) containers.

When I was first learning Kubernetes, I was a bit confused about the pod concept. The whole point of splitting things into smaller services is to be able to deploy them independently right?

I think part of my confusion was due to some early descriptions I heard. For example: "if you have an app that depends on a database, you might deploy the app container and database container in the same pod, so they're created and destroyed together".

I don't want to say that's wrong, but it's an example of something I would specifically not do! It's far more common to have pods that contain a single container - for example a "payment API" or the "orders API". Each of those APIs may have different scaling needs, different deployment and iteration rates, different SLAs, and so on, so it makes sense for them to be in separate pods. Similarly, a database container would be deployed in its own separate pod, as it generally will have a different lifecycle to your app/services.

What is relatively common is having "supporting" containers deployed alongside the "main" container in a pod, using the sidecar pattern. These sidecar containers handle cross-cutting concerns for the main application. For example, they might act like a proxy and handle authentication for the main app, handle service discovery and service-mesh behaviours, or act as a sink for application performance monitoring. This is the pattern that the new Dapr runtime relies on.

A node containing 4 pods, 2 of the pods have 3 containers, 2 of the pods have a single container
A Node can run multiple pods. Each pod contains one or more container, often with a single "main" container and optional sidecars

The ability to deploy "pods" rather than individual containers like this makes composability and handling cross-cutting concerns easier. But the chances are that when you start, your pods will just have a single container: the app/API/service that you're deploying. So in most cases, when you see/hear "pod" you can think "container".

tl;dr; Pods are a collection of containers that Kubernetes schedules as a single unit. Initially your pods will likely contain a single container, one for each API or app you're deploying.

Deployments

I've said that Kubernetes is an orchestrator, but what does that really mean? You can run Docker containers without an orchestrator using docker run payment-api, so what does Kubernetes add?

Orchestration in my mind is primarily about two things:

  • Managing the lifetime of containers
  • Managing the communication between containers

Deployments in Kubernetes are related to the first of those points, managing the lifetime of containers. You can think of a deployment as a set of declarative statements about how to deploy a pod, and how Kubernetes should manage it. For example, a deployment might say:

  • The pod contains one instance of the payment-api:abc123 Docker image
  • Run 3 separate instances of the pod (the number of replicas)
  • Ensure the payment-api:abc123 container has 200Mb of memory available to it, but limit it to using a max of 400Mb
  • When deploying a new version of a pod use a rolling update strategy

Kubernetes will do its best to honour the rules you define in a deployment. If your app crashes, Kubernetes will remove the pod and schedule a new one in order to keep the number of replicas you've specified. If your pod needs more memory, it may start running it on a different node where there are fewer containers running, or it might kill it and redeploy it. The key is that it moves towards the desired state specified in the deployment.

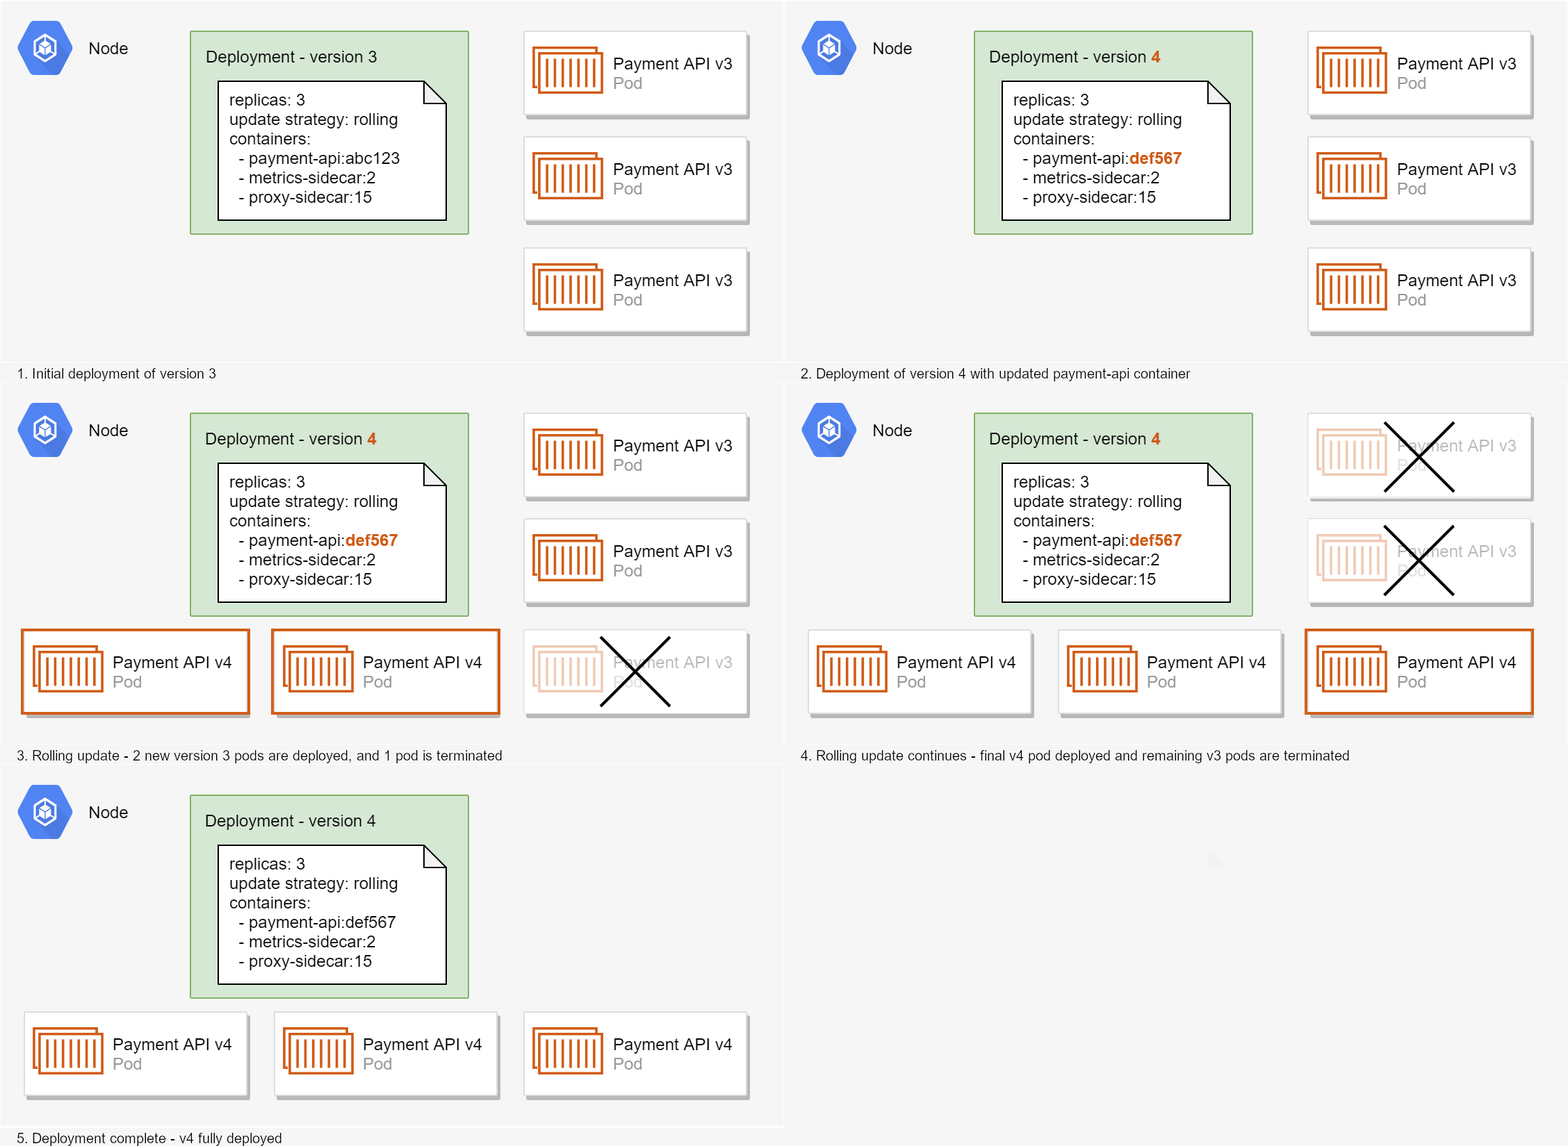
When you deploy a new version of your app (e.g. Docker image payment-api:def567) you create a new deployment in the cluster, replacing the previous deployment. Kubernetes will work on moving from the previous state to the new desired state, killing and starting pods as necessary.

Animated gif of a new deployment using rolling update strategy

In the animated example shown above, the cluster initially has three replicas of the payment-api:abc123 pod running. Then a new deployment is applied (version 4) that requires 3 instances of payment-api:def567 (a different docker image). Based on the "rolling update" strategy defined by the deployment, Kubernetes decides to take the following action:

  • Start two new instances of the payment-api:def567 pod and stop one instance of the payment-api:abc123 pod
  • Wait for the two new instances to start handling requests
  • Once the new pods are working, stop the remaining payment-api:abc123 pods and start the last required payment-api:def567 pod

This example is simplified (I've only considered one node for example), but it describes the general idea. The key takeaway is that deployments define the desired state, which Kubernetes aims to maintain throughout the lifetime of the deployment. You'll see the technical side of creating deployments in the next post in the series in which we look at manifests.

tl;dr; Deployments are used to define how Pods are deployed, which Docker images they should use, how many replicas should be running, and so on. They represent the desired state for the cluster, which Kubernetes works to maintain.

Services

You've seen that a deployment can be used to create multiple replicas of a pod, spread across multiple nodes. This can improve performance (there's more instances of your app able to handle requests) and reliability (if one pod crashes, other pods can hopefully take up the slack).

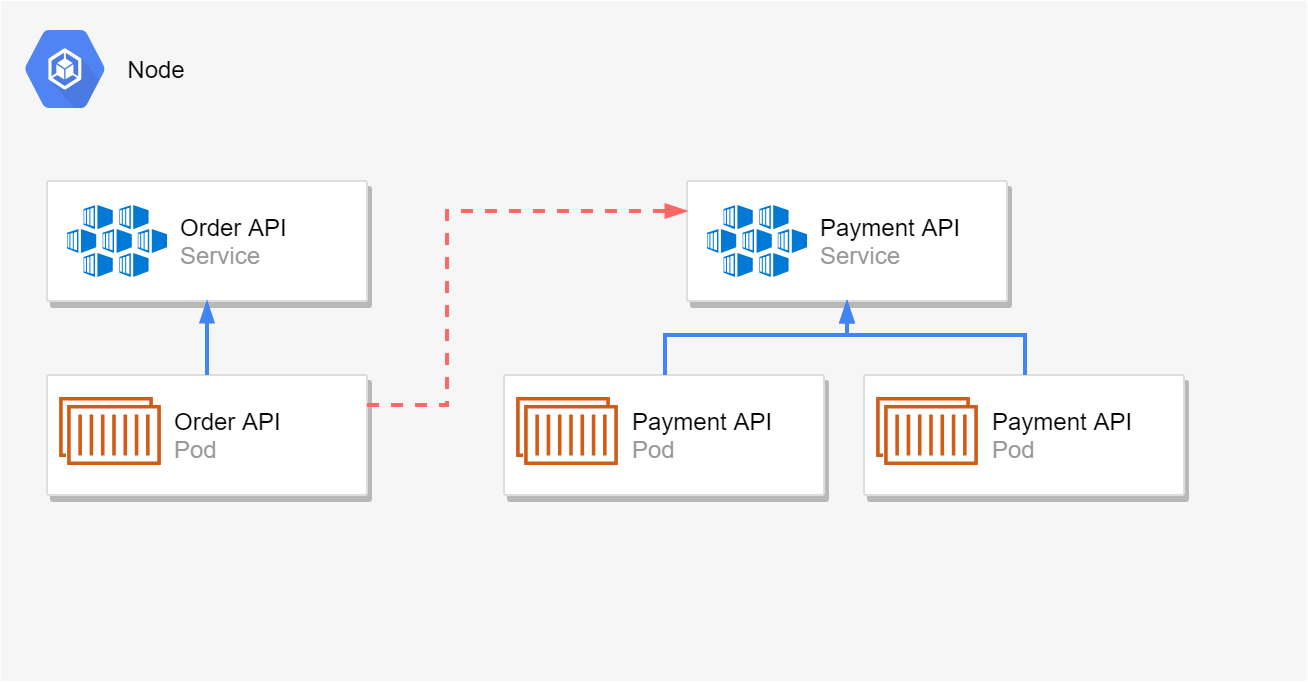
I think of a service as effectively an in-cluster load-balancer for your pods. When you create a deployment, you will likely also create a service associated with that app's pods. If your deployment requires three instances of the "purchasing app", you'll create a single service to go with it.

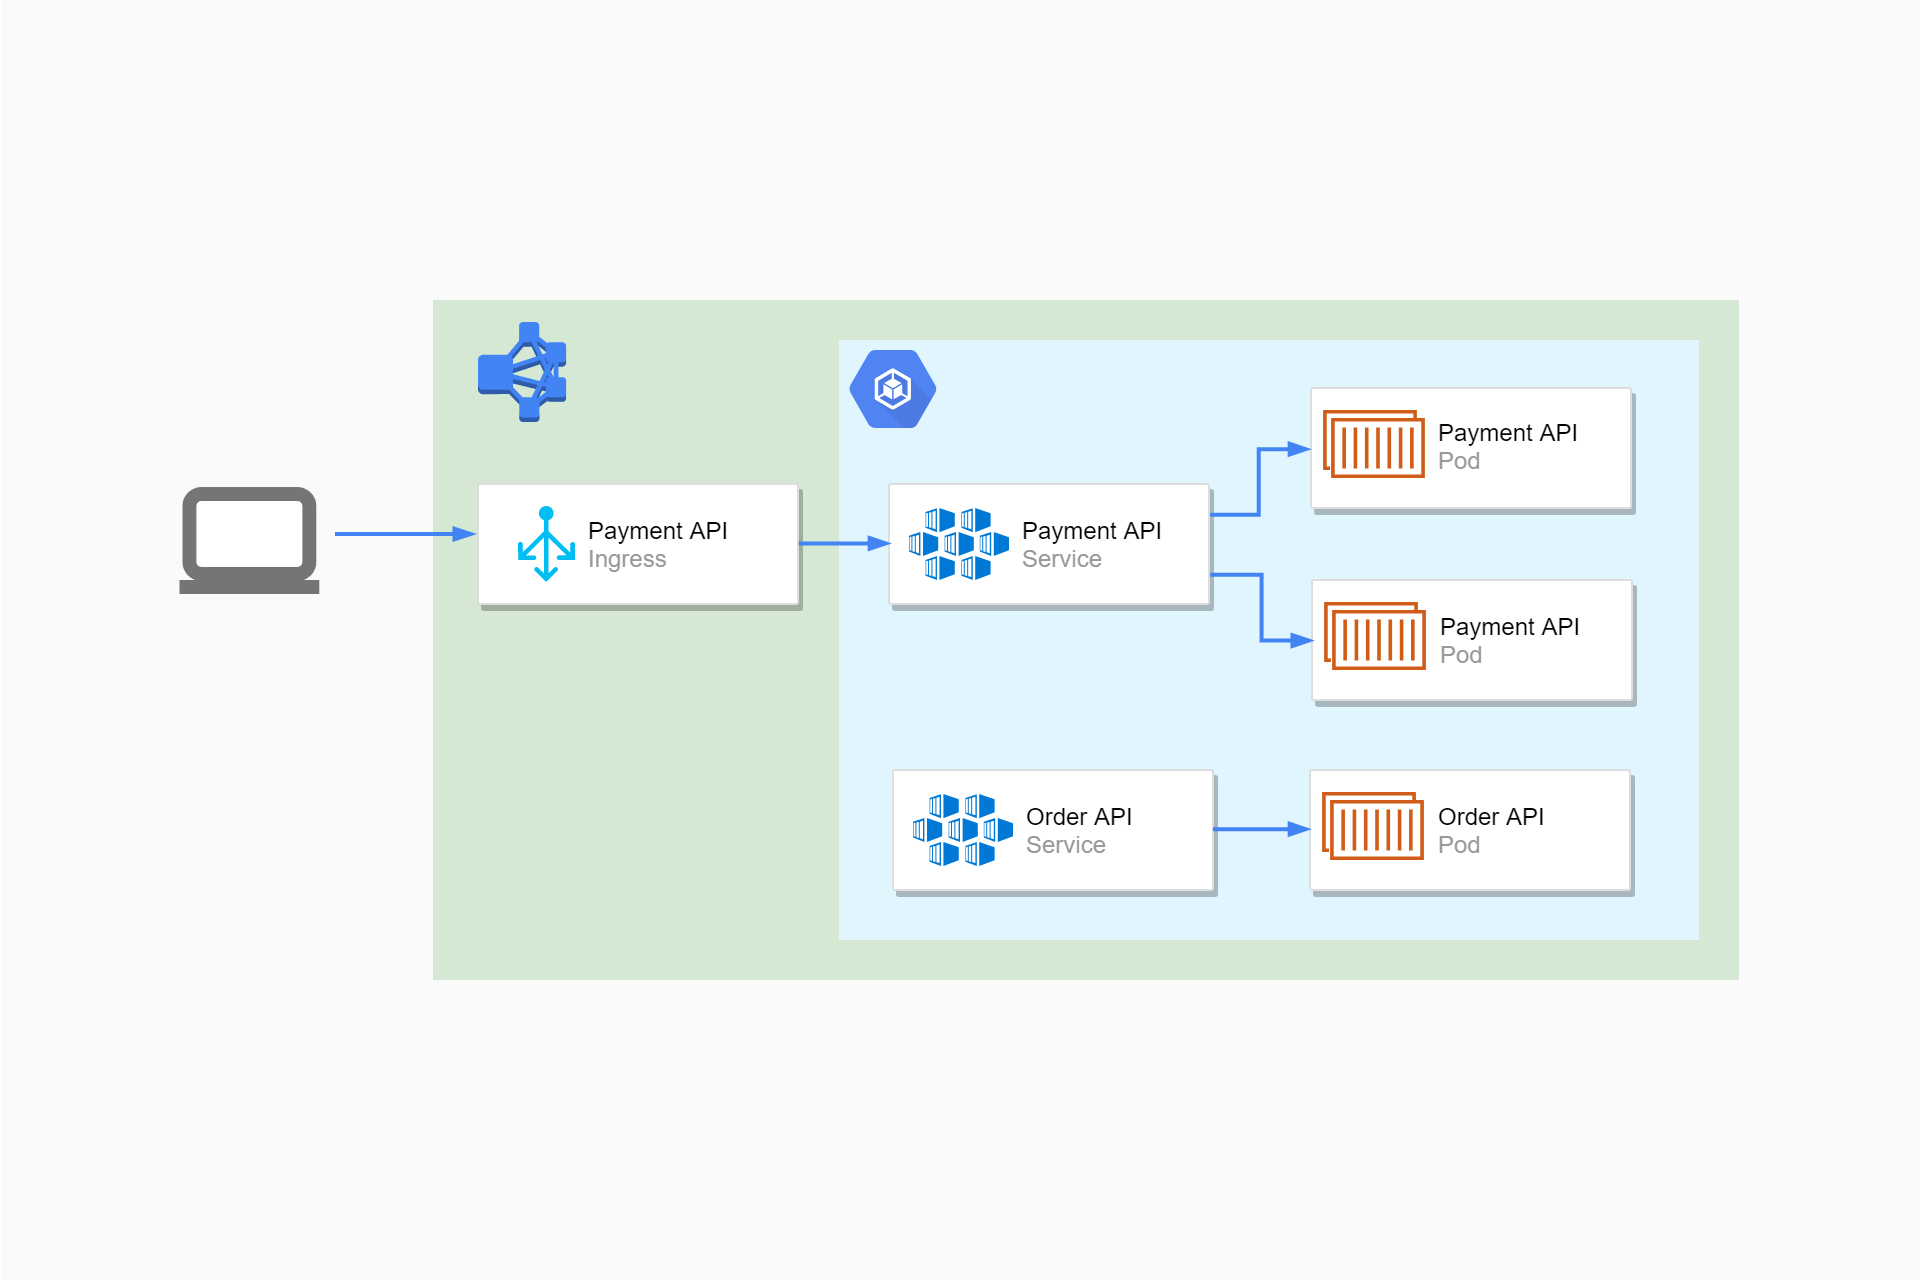
When one pod needs to talk to another, for example the "Order API" needs to contact the "Payment API", it doesn't contact a pod directly. Instead, it sends the request to the service, which is responsible for passing the request to the pod.

A service for the Order API containing one pod, a service for the Payments API containing 2 pods. The Order API pod is calling the Payments API service
A service acts as an internal load-balancer for the pods. Pods talk to other pods via services, instead of contacting them directly.

There are a number of different networking modes to services that I won't go through here, but there's one pattern that's commonly used in Kubernetes: Services are assigned a DNS record that you can use to send requests from one pod/service to another.

For example, imagine you have a service called purchasing-api that your "Ordering API" pods need to invoke. Rather than having to hard code real IP Addresses or other sorts of hacks, Kubernetes assigns a standard DNS record to the service:

purchasing-api.my-namespace.svc.cluster.local

By sending requests to this domain, the Ordering API can call the "Purchasing API" without having to know the correct IP Address for an individual pod. Don't worry about this too much for now, just know that by creating a service it makes it easier to call your app from other pods in your cluster.

Namespaces work exactly as you would expect from the .NET world. They're used to logically group resources. In the example above, the service has been created in the my-namespace namespace.

tl;dr; Services are internal load balancers for a set of identical pods. They are assigned DNS records to make it easier to call them from other pods in the cluster.

Ingresses

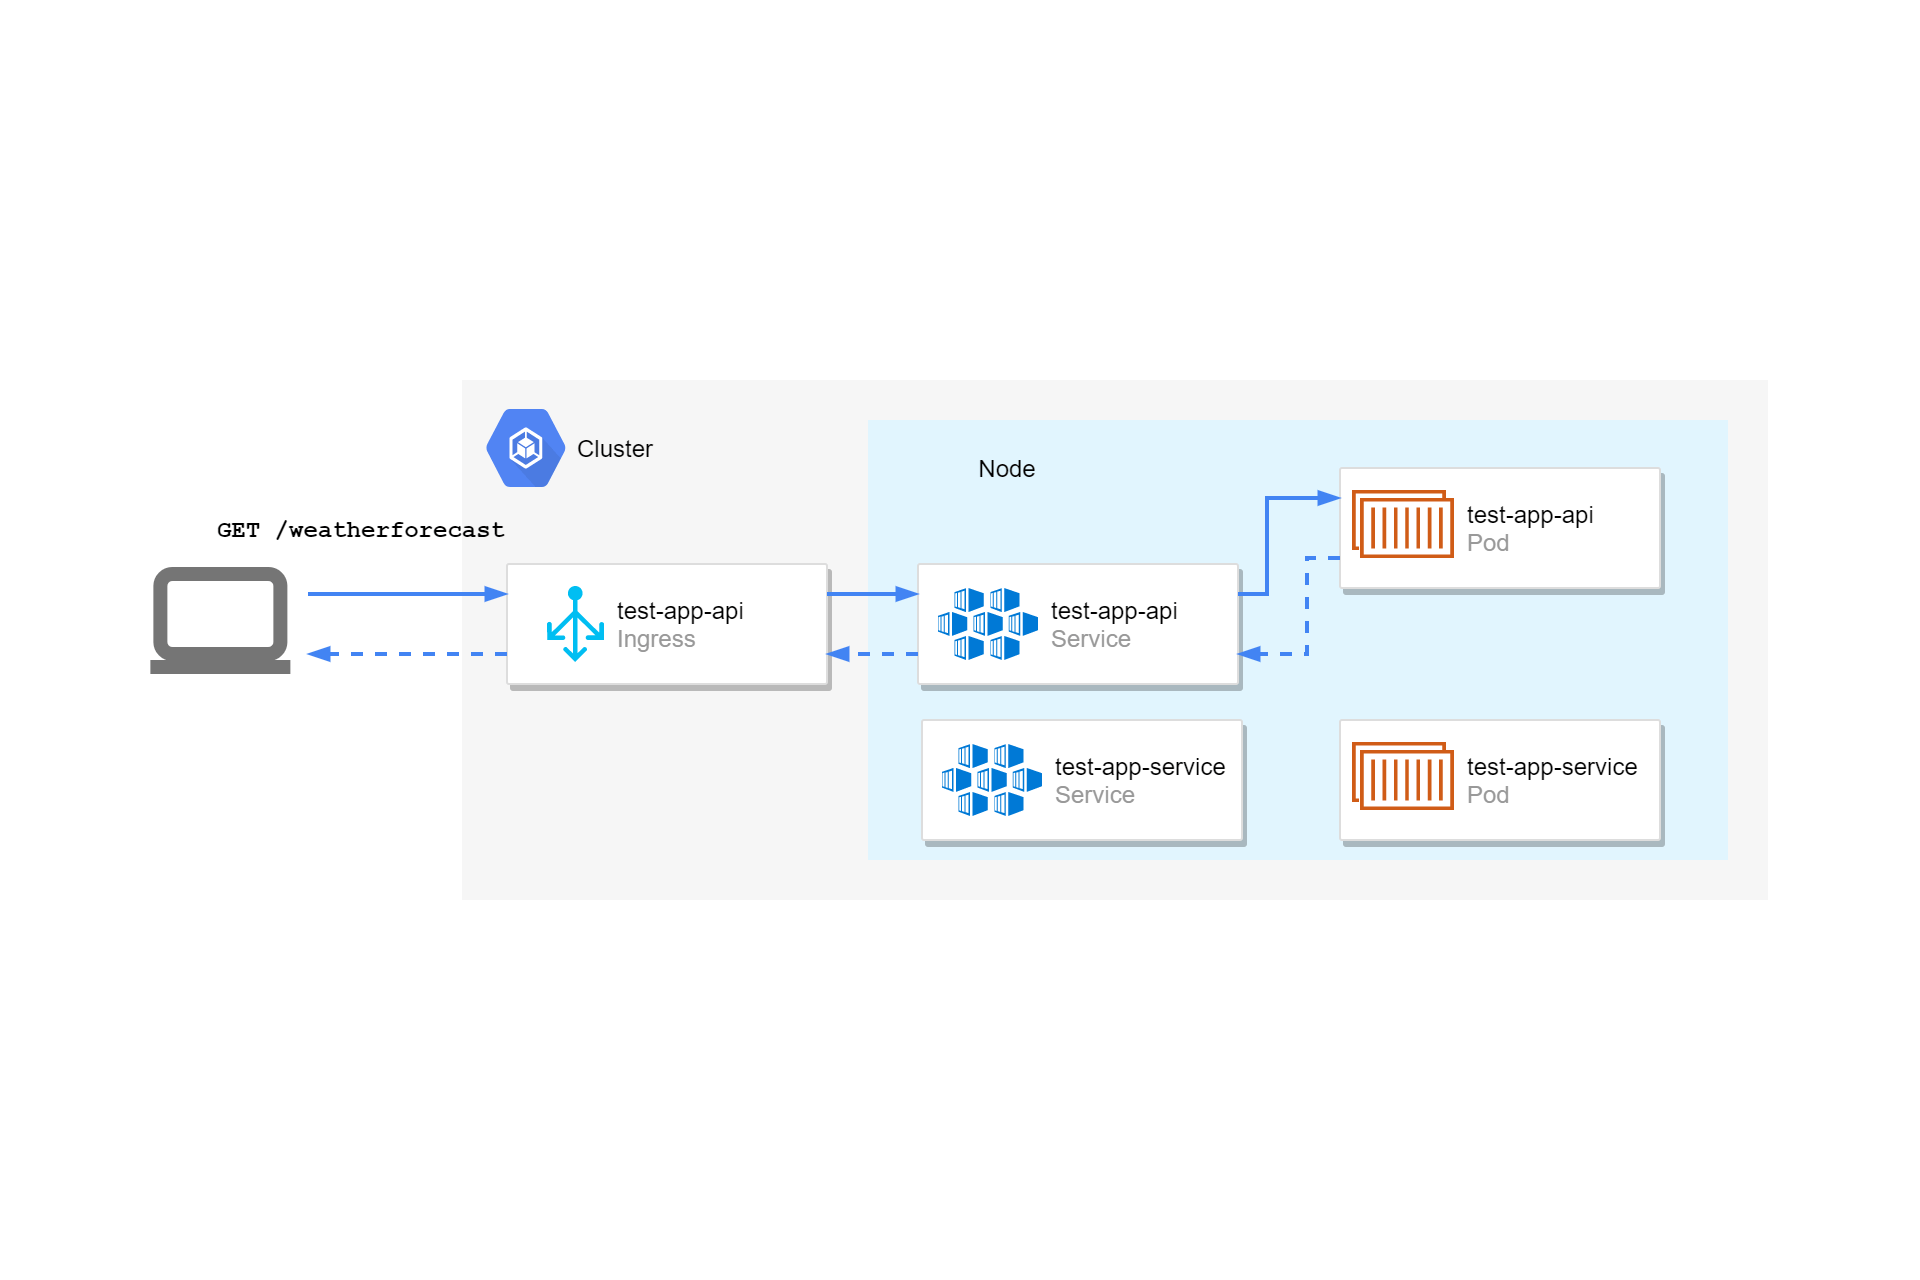
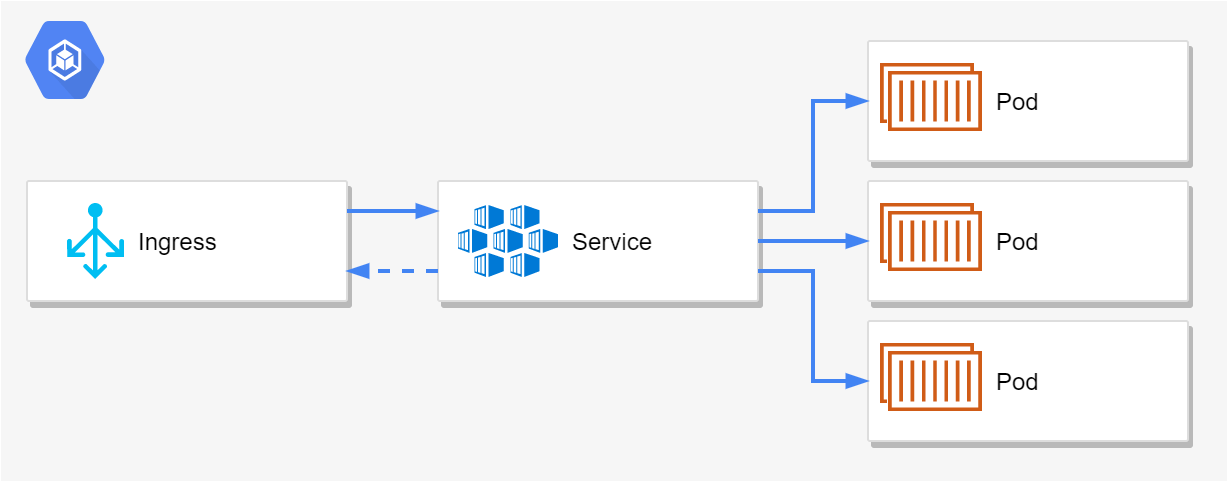
Services are essentially internal to the Kubernetes cluster. Your apps (pods) can call one another using services, but this communication is all internal to the cluster. An ingress exposes HTTP/HTTPS routes from outside the cluster to your services. Ingresses allow your ASP.NET Core applications running in Pods to actually handle a request from an external user:

Image of a client making a request to a kubernetes cluster, passing through an ingress, to a service, and a pod
An Ingress exposes HTTP endpoints for a service that clients can call. HTTP requests to the endpoint are forwarded by the Ingress to the associated service on a node, which passes the request to the Pod.

While services are internal load balancers for your pods, you can think of Ingresses as providing external load balancing, balancing requests to a given service across multiple nodes.

As well as providing external HTTP endpoints that clients can invoke, ingresses can provide other features like hostname or path-based routing, and they can terminate SSL. You'll generally configure an ingress for each of your ASP.NET Core applications that expose HTTP APIs.

Ingresses effectively act as a reverse-proxy for your app. For example, in one ingress controller implementation, Kubernetes configures your ingresses by configuring an instance of NGINX for you. In another implementation, Kubernetes configures an AWS ALB load balancer for you instead. It's important that you design your apps to be aware of the fact they're likely behind a reverse proxy, rather than being exposed directly to the internet. I'll discuss what that involves at various points throughout this series.

tl;dr; Ingresses are used to expose services at HTTP endpoints. They act as reverse proxies for your services, load-balancing requests between different services running on different nodes.

Summary

This post was a whistle-stop tour of the parts of Kubernetes I think are most important to application developers. When you deploy an ASP.NET Core application, you'll likely be configuring a deployment of pods, adding a service to expose those pods internally, and adding an ingress to expose the service publicly. In future posts in this series, I'll describe how to use theses components to deploy an ASP.NET Core application to Kubernetes.

Configuring resources with YAML manifests: Deploying ASP.NET Core applications to Kubernetes - Part 2

$
0
0
Configuring resources with YAML manifests

In my previous post I talked about some of the fundamental components of Kubernetes like pods, deployments, and services. In this post I'll show how you can define and configure these resources using YAML manifests. I'm not going to go into how to deploy these resources until the next post, where I'll introduce the tool Helm.

In this post I'll describe the manifests for the resources I described in the previous post: pods, deployments, services, and ingresses. I'm not going to go through all the different configuration options and permutations that you could use, I'm just going to focus on the most common sections, and the general format. In later posts in this series we'll tweak the manifests to add extra features to help deploying your ASP.NET Core applications to Kubernetes.

Defining Kubernetes objects with YAML manifests

There are several different ways to create objects in a Kubernetes cluster - some involve imperative commands, while others are declarative, and describe the desired state of your cluster.

Either way, once you come to deploying a real app, you'll likely end up working with YAML configuration files (also called manifests). Each resource type manifest (e.g. deployment, service, ingress) has a slightly different format, though there are commonalities between all of them. We'll look at the deployment manifest first, and then take a detour to discuss some of the features common to most manifests. We'll follow up by looking at a service manifest, and finally an ingress manifest.

The deployment and pod manifest

As discussed in the previous post, pods are the "smallest deployable unit" in Kubernetes. Rather than deploying a single container, you deploy a pod which may contain one or more containers. It's totally possible to deploy a standalone pod in Kubernetes, but when deploying applications, it's far more common to deploy pods as part of a "deployment" resource.

See my previous post for a description of the Kubernetes deployment resource.

For that reason, you typically define your pod resources inside a deployment manifest. That is, you don't create your pods and then create a deployment to manage them; you create a deployment which knows how to create your pods for you.

With that in mind, lets take a look at a relatively basic deployment manifest.

apiVersion: apps/v1
kind: Deployment
metadata:
  name: nginx-deployment
  labels:
    app: nginx
spec:
  replicas: 3
  strategy: 
    type: RollingUpdate
    rollingUpdate:
      maxUnavailable: 1
  selector:
    matchLabels:
      app: nginx
  template:
    metadata:
      labels:
        app: nginx
    spec:
      containers:
      - name: nginx
        image: nginx:1.7.9
        ports:
        - containerPort: 80

I'll walk through each section of the YAML below.

Remember, YAML is whitespace-sensitive, so take care with indenting when writing your manifests!

The deployment apiVersion, kind, and metadata

The first three keys in the manifest, apiVersion, kind, and metadata, appear at the start of every Kubernetes manifest.

apiVersion: apps/v1

Each manifest defines an apiVersion to indicate the version of the Kubernetes API it is defined for. Each version of Kubernetes supports a number of different API versions for both the core resource APIs and extension APIs. Most of the time you won't need to worry about this too much, but it's worth being aware of.

kind: Deployment

The kind defines the type of resource that the manifest is for, in this case it's for a deployment. Each resource will use a slightly different format in the body of the manifest.

metadata:
  name: nginx-deployment
  labels:
    app: nginx

The metadata provides details such as the name of the resource, as well as any labels attached to it. Labels are key-value pairs associated with the resource - I'll discuss them further in a later section. In this case, the deployment has a single label, app, with the value nginx.

The spec section

For all but the simplest resources, Kubernetes manifests will include a spec section that defines the configuration for the specified kind of resource. For the deployment manifest, the spec section defines the containers that make up a single pod, and also how those pods should be scaled and deployed.

replicas: 3
strategy: 
  type: RollingUpdate
  rollingUpdate:
    maxUnavailable: 1

The replicas and strategy keys define how many instances of the pod the deployment should aim to create, and the approach it should use to create them. In this case, we've specified that we want Kubernetes to keep three pods running at any one time, and that Kubernetes should perform a rolling update when new versions are deployed.

We've also defined some configuration for the rolling update strategy, by setting maxUnavailable to 1. That means that when a new version of a deployment is released, and old pods need to replaced with new ones, the deployment will only remove a single "old" pod at a time before starting a "new" one.

As with much of Kubernetes, there's a plethora of configuration for each resource. For example, for deployments you can control how many additional containers a rolling update should add at a time (MaxSurge), or how many seconds a container needs to be running for it to be considered available (MinReadySeconds). It's worth checking the documentation for all the options.

selector:
  matchLabels:
    app: nginx

The selector section of the deployment manifest is used by a deployment to know which pods it is managing. I'll discuss the interplay of metadata and selectors in the next section, so we'll move on for now.

template:
  metadata:
    labels:
      app: nginx
  spec:
    containers:
    - name: nginx
      image: nginx:1.7.9
      ports:
      - containerPort: 80

The final element in the spec section of a deployment is the template. This is a "manifest-inside-a-manifest", in that its contents are effectively the manifest for a pod. So with this one deployment manifest you're defining two types of resources: a pod (which can optionally contain multiple containers, as I described previously), and a deployment to manage the scaling and lifecycle of that pod.

Technically you're also managing a ReplicaSet resource but I consider that to mostly be an implementation detail you don't need to worry about.

The pod template in the above example defines a single container, named nginx, built from the nginx:1.7.9 Docker image. The containerPort defined here describes the port exposed inside the container: this is primarily informational, so you don't have to provide it, but it's good practice to do so.

If you wanted to deploy two containers in a pod, you would add another element to the containers list, something like the following:

template:
  metadata:
    labels:
      app: nginx
  spec:
    containers:

    - name: nginx
      image: nginx:1.7.9
      ports:
      - containerPort: 80

    - name: hello-world
      image: debian
      command: ["/bin/sh"]
      args: ["-c", "echo Hello world"]

In this example our pod contains two containers: the nginx:1.7.9 image, and a (useless!) debian image configured to just echo "Hello world" to the console

We've traversed a whole deployment manifest now, but there's many more things you could configure if you wish. We'll look at some of those in later posts, but we've covered the basics.

Although each manifest kind has a slightly different spec definition, they all have certain things in common, such as the role of metadata and selectors. In the next section I'll cover how and why those are used, as it's an important concept.

The role of labels and selectors in Kubernetes

Labels are a simple concept that are used extensively throughout Kubernetes. They're key-value pairs associated with an object. Each object can have many different labels, but each key can only be specified once.

Taking the previous example manifest, the section:

metadata:
  name: nginx-deployment
  labels:
    app: nginx

adds the key app to the deployment object, with a value of nginx. Similarly, in the spec.template section of the deployment (where you're defining the pod manifest):

spec: 
  template:
    metadata:
      labels:
        app: nginx

This adds the same key-value pair to the pod. Both of these examples only added a single label, but you can attach any number. For example, you could tag objects with an environment label to signify dev/staging/production, and a system label to indicate frontend/backend

metadata:
  labels:
    app: nginx
    environment: staging
    system: frontend

Labels can be useful when you want to use the command line to query your cluster with the command line program kubectl. For example, you could use the following to list all the pods that have both the frontend and staging labels:

kubectl get pods -l environment=staging,system=frontend

Labels are mostly informational so you can sprinkle them liberally as you see fit. But they are also used integrally by Kubernetes wherever a resource needs to reference other resources. For example, the deployment resource described earlier needs to know how to recognise the pods it is managing. It does so by defining a selector.

selector:
  matchLabels:
    app: nginx

A selector defines a number of conditions that must be satisfied for an object to be considered a match. For example, the selector section above (taken from the deployment resource) will match all pods that have the app label and have a value of nginx.

The selector version of the kubectl query above would look like the following

selector:
  matchLabels:
    environment: staging
    system: frontend

Note that for a pod to be a match, it would have to have all of the listed labels (i.e. the labels are combined using AND operators). Therefore, your selectors may well specify fewer labels than are added to your pods - you only need to include enough matchLabels such that your pods can be matched unambiguously.

Some resources also support matchExpressions that let you use set-based operators such as In, NotIn, Exists, and DoesNotExist.

This section seems excessively long for a relatively simple concept, but selectors are one of the places where I've messed up our manifests. By using an overly-specific selector, I found I couldn't upgrade our apps as the new version of a deployment would no longer match the pods. I realise that's a bit vague, but just think carefully about what you're selecting! 🙂

Deployments aren't the only resources that use selectors. Services use the same mechanism to define which pods they pass traffic to.

The service manifest

In my previous-post I described services as "in-cluster load balancers". Each pod is assigned its own IP address, but pods can be started, stopped, or could crash at any point. Instead of making requests to pods directly, you can make requests to a service instead, which forwards the request to one of its associated pods.

Due to the fact that services deal with networking, I find them one of the trickiest resources to work with in Kubernetes, as configuring anything beyond the basics seems to require a thorough knowledge of networking in general. Luckily, in most cases the basics gets you a long way!

The following manifest is for a service that acts as a load balancer for the pods that make up the back-end of an application called "my-shop". As before, I'll walk through each section of the manifest below:

apiVersion: v1
kind: Service
metadata:
  name: my-shop-backend
  labels: 
    app: my-shop
    system: backend
spec:
  type: ClusterIP
  selector:
    app: my-shop
    system: backend
  ports:
  - port: 80
    targetPort: 8080
    protocol: TCP

The service apiVersion, kind, and metadata

As always, the manifest starts by defining the kind of manifest (Service) and the version of the Kubernetes API required. The metadata assigns a name to the service, and adds two labels: app:my-shop and system:backend. As before, these labels are primarily informational.

The service spec

The spec section of the manifest starts by defining the type of service we need. Depending on the version of Kubernetes you're using, you'll have up to four options:

  • ClusterIP. The default value, this makes the service only reachable from inside the cluster.
  • NodePort. Exposes the service publicly on each node at an auto-generated port.
  • LoadBalancer. Hooks into cloud providers like AWS, GCP, and Azure to create a load balancer which is used to handle the load balancing.
  • ExternalName Works differently to other services, in that it does not proxy or forward directly to any pods. Instead it is used to map an internal DNS service name to another DNS CNAME.

If you're confused, don't worry. For ASP.NET Core applications, you can commonly use the default ClusterIP to act as an "internal" load-balancer, and use an ingress to route external HTTP traffic to the service.

spec:
  selector:
    app: my-shop
    system: backend

Next in the spec section is a selector. This is how you control which pods a service is load balancing. As described in the previous section, the selector will select all pods that have all of the required labels, so in this case app:my-shop and system:backend. The service will route any incoming requests to those services.

spec:
  ports:
  - port: 80
    targetPort: 8080
    protocol: TCP

Finally, we come to the ports section of the spec. This defines the port that the service will be exposed on (port 80) and the IP Protocol to use (TCP in this case, but could be UDP for example). The targetPort is the port on the pods that traffic should be routed to (8080). For details on other option available here, see the documentation or API reference.

For ASP.NET Core applications, you typically want to expose some sort of HTTP service to the wider internet. Deployments handle replication and scaling of your app's pods, and services provide internal load-balancing between them, but you need an ingress to expose your application to traffic outside your Kubernetes cluster.

The ingress manifest

As described in my last post, an ingress acts as an external load-balancer or reverse-proxy for your internal Kubernetes service. The following manifest shows how you could expose the my-shop-backend service publicly:

apiVersion: extensions/v1beta1
kind: Ingress
metadata:
  name: my-shop-backend-ingress
  labels: 
    app: my-shop
    system: backend
  annotations:
    nginx.ingress.kubernetes.io/rewrite-target: /
spec:
  rules:
  - http:
      host: api.my-shop.com
      paths:
      - path: /my-shop
        backend:
          serviceName: my-shop-backend
          servicePort: 80

The ingress apiVersion, kind, and metadata

As always, the manifest contains an API version and a kind for the manifest. The metadata also includes a name for the ingress, and labels associated with the object. However we also have a new element, annotations. Annotations work very similarly to labels, in that they are key-value pairs of data. The main difference is that annotations can't be used for selecting objects.

In this case, we've added the annotation nginx.ingress.kubernetes.io/rewrite-target with a value of /. This annotation uses a special key that is understood by the NGINX ingress controller which tells the controller it should rewrite the "matched-path" of incoming requests to be /.

For example, if a request is received at the following path:

/my-shop/orders/123

the ingress controller will rewrite it to

/orders/123

by stripping the /my-shop segment defined in the spec below.

In order to use an ingress, your cluster needs to have an ingress controller deployed. Each ingress controller has slightly different features, and will require different annotations to configure it. Your ingress manifests will therefore likely differ slightly depending on the specific ingress controller you're using.

The ingress spec

The spec section of an ingress manifest contains all the rules required to configure the reverse-proxy managed by the cluster's ingress controller. If you've ever used NGINX, HAProxy, or even IIS, an ingress is fundamentally quite similar. It defines a set of rules that should be applied to incoming requests to decide where to route them.

Each ingress manifest can define multiple rules, but bear in mind the "deployable units" of your application. You will probably include a single ingress for each application you deploy to Kubernetes, even though you could technically use a single ingress across all of your applications. The ingress controller will handle merging your multiple ingresses into a single NGINX (for example) config.

spec:
  rules:
  - http:
      host: api.my-shop.com
      paths:
      - path: /my-shop
        backend:
          serviceName: my-shop-backend
          servicePort: 80

An http rule can optionally define a host (api.my-shop.com in this case) if you need to run different applications in a cluster at the same path, and differentiate based on hostname. Otherwise, you define the match-path to use (/my-shop). It is this match-path which is re-written to / based on the annotation in the metadata section.

As well as the path and host to match incoming requests, you define the internal service that requests should be forwarded to, and the port to use. In this case we're routing to the my-shop-backend service defined in the previous section, using the same port (80).

This simple example matches incoming requests to a single service, and is probably the most common ingress I've used. However in some cases you might have two different types of pod that make up one logical "micro-service". In that case, you would also have two Kubernetes services, and could use path based routing to both services inside a single ingress, e.g.:

spec:
  rules:
  - http:
      paths:
      - path: /orders
        backend:
          serviceName: my-shop-orders-service
          servicePort: 80
  - http:
      paths:
      - path: /history
        backend:
          serviceName: my-shop-order-history-backend
          servicePort: 80

As always in Kubernetes, there's a multitude of other configuration you can add to your ingresses, and if you're having issues it's worth consulting the documentation. However if you're deploying apps to an existing Kubernetes cluster, this is probably most of what you need to know. The main thing to be aware of is which ingress controller you're using in your cluster.

Summary

In this post I walked through each of the main Kubernetes resources that app-developers should know about: pods, deployments, services, and ingresses. For each resource I showed an example YAML configuration file that can be used to deploy the resource, and described some of the most important configuration values. I also discussed the importance of labels and selectors for how Kubernetes links resources together.

In the next post, I'll show how to manage the complexity of all these manifests by using Helm charts, and how that can simplify deploying applications to a Kubernetes cluster.

An introduction to deploying applications with Helm: Deploying ASP.NET Core applications to Kubernetes - Part 3

$
0
0
An introduction to deploying applications with Helm

In the first post in this series I described some of the fundamental Kubernetes resources that you need to understand when deploying applications, like pods, deployments, and services. In my previous post I described the YAML manifests that are used to define and create these resources.

In this post, I'll show one approach to deploying those resources to a Kubernetes cluster. Most tutorials on Kubernetes show how to deploy resources by passing YAML files to the the kubectl command line tool. This is fine when you're initially getting started with Kubernetes, but it's less useful when you come to deploy your apps in practice. Instead, in this post I describe Helm and discuss some of the benefits it can provide for managing and deploying your applications.

What is Helm?

From the Helm GitHub repository:

Helm is a tool for managing Kubernetes charts. Charts are packages of pre-configured Kubernetes resources.

So Helm is a tool for managing Kubernetes charts—but what's a chart?!

Helm charts as a unit of deployment

When you deploy an application to Kubernetes, you typically need to configure many different resources. If you consider a publicly-facing ASP.NET Core application, you typically need as a minimum:

  • A deployment, containing a pod consisting of your Dockerised ASP.NET Core application
  • A service, acting as a load balancer for the pods making up your deployment
  • An ingress, to expose the service as an HTTP endpoint

Each of those resources is defined in a separate YAML manifest, but your application logically requires all of those components to function correctly - you need to deploy them as a unit.

A Helm chart is a definition of the resources that are required to run an application in Kubernetes. Instead of having to think about all of the various deployments/services/ingresses that make up your application, you can use a command like

helm install stable/redis

and Helm will make sure all the required resources are installed. The above command will install the standard redis chart. Behind the scenes, a helm chart is essentially a bunch of YAML manifests that define all the resources required by the application. Helm takes care of creating the resources in Kubernetes (where they don't exist) and removing old resources.

The stable/redis chart used above includes 15 different Kubernetes resources. Packaging them in this way is certainly more convenient to install, but its real power comes when you need to update your application.

Parameterising manifests using Helm templates

Let's consider that you have an application which you have Dockerised into an image, my-app, and that you wish to deploy with Kubernetes. Without helm, you would create the YAML manifests defining the deployment, service, and ingress, and apply them to your Kubernetes cluster using kubectl apply. Initially, your application is version 1, and so the Docker image is tagged as my-app:1.0.0. A simple deployment manifest might look something like the following:

apiVersion: apps/v1
kind: Deployment
metadata:
  name: my-app-deployment
  labels:
    app: my-app
spec:
  replicas: 3
  strategy: 
    type: RollingUpdate
    rollingUpdate:
      maxUnavailable: 1
  selector:
    matchLabels:
      app: my-app
  template:
    metadata:
      labels:
        app: my-app
    spec:
      containers:
      - name: my-app
        image: "my-app:1.0.0"
        ports:
        - containerPort: 80

Now lets imagine you produce another version of your app, version 1.1.0. How do you deploy that? Assuming nothing needs to be changed with the service or ingress, it may be as simple as copying the deployment manifest and replacing the image defined in the spec section. You would then re-apply this manifest to the cluster, and the deployment would be updated, performing a rolling-update as I described in my first post.

The main problem with this is that all of the values specific to your application – the labels and the image names etc – are mixed up with the "mechanical" definition of the manifest.

Helm tackles this by splitting the configuration of a chart out from its basic definition. For example, instead of baking the name of your app or the specific container image into the manifest, you can provide those when you install the chart into the cluster.

For example, a simple templated version of the previous deployment might look like the following:

apiVersion: apps/v1
kind: Deployment
metadata:
  name: {{ .Release.Name }}-deployment
  labels:
    app: "{{ template "name" . }}"
spec:
  replicas: 3
  strategy: 
    type: RollingUpdate
    rollingUpdate:
      maxUnavailable: 1
  selector:
    matchLabels:
      app: "{{ template "name" . }}"
  template:
    metadata:
      labels:
        app: "{{ template "name" . }}"
    spec:
      containers:
      - name: "{{ template "name" . }}"
        image: "{{ .Values.image.name }}:{{ .Values.image.tag }}"
        ports:
        - containerPort: 80

This example demonstrates a number of features of Helm templates:

  • The template is based on YAML, with {{ }} mustache syntax defining dynamic sections.
  • Helm provides various variables that are populated at install time. For example, the {{.Release.Name}} allows you to change the name of the resource at runtime by using the release name. Installing a Helm chart creates a release (this is a Helm concept rather than a Kubernetes concept).
  • You can define helper methods in external files. The {{template "name"}} call gets a safe name for the app, given the name of the Helm chart (but which can be overridden). By using helper functions, you can reduce the duplication of static values (like my-app), and hopefully reduce the risk of typos.
  • You can manually provide configuration at runtime. The {{.Values.image.name}} value for example is taken from a set of default values, or from values provided when you call helm install.

There are many different ways to provide the configuration values needed to install a chart using Helm. Typically, you would use two approaches:

  1. A values.yaml file that is part of the chart itself. This typically provides default values for the configuration, as well as serving as documentation for the various configuration values
  2. Values provided on the command line at runtime when installing a chart.

When providing configuration on the command line, you can either supply a file of configuration values using -f config.yaml:

helm install -f config.yaml --name my-release stable/redis

or you can override individual values using --set myvalue=2:

helm install --set image.tag=5.0.0 --name my-release stable/redis

In both of these examples I also provided a name for the release, my-release. This will be used by Helm to populate the .Release.Name value.

When you run the helm install command above, this creates a Helm release. Helm applies the provided configuration, in this case the image.tag value, to all of the manifests associated with the stable/redis Helm chart. It then applies the manifests to your helm cluster, adding and removing resources as necessary to achieve the desired state.

The added complexity of Helm charts

On the face of it, adding Helm to the already complex set of things to learn before you can deploy to Kubernetes may seem unnecessary. It's definitely not required, but I think it makes a lot of sense to just start with it. As an ASP.NET Core developer, you're likely already familiar with the concept of separating configuration from the implementation, and that's essentially what Helm does.

Another benefit, is that I find that most of the charts for the ASP.NET Core applications I've written end up looking almost identical. The only real differences are in the configuration values. That means creating a helm chart for a new application often involves a simple copy-paste of the chart, and tweaking a couple of values in the configuration file.

In previous versions of Helm, you had to install two tools to use Helm: a client-side tool, and a service inside your Kubernetes cluster. Thankfully, in Helm version 3 they removed the server-side service. That makes the installation process for Helm much simpler, and in general just involves downloading a binary to your local machine.

Helm makes it easy to deploy applications, whether that's your own apps, an app like ghost blog, or an infrastructure "app" like Redis or ElasticSearch. In later posts in these series we'll be tweaking helm charts to work with ASP.NET Core applications, so it's worth getting to grips with them.

The documentation site is very detailed, but can be a little dry initially. Nevertheless, it's a great resource when you start authoring templates.

In the next post we'll get deeper into Helm charts and templates, and will look at creating our own chart for a small ASP.NET Core app. In the meantime, if you haven't already, consider installing Helm and experiment with installing and uninstalling charts in a test Kubernetes cluster. The later posts in this series assume a basic familiarity with the process, rather than providing an in-depth introduction.

Summary

In this post, I provided a brief overview of Helm, and described some of the benefits it provides over manually managing your applications in Kubernetes. Helm charts are packages of Kubernetes resources which are installed into a Kubernetes cluster as a unit. Helm templates, which make up a chart, separate the definition of a resource, which is largely static, from its configuration, which may differ with each installation.

Creating a Helm chart for an ASP.NET Core app: Deploying ASP.NET Core applications to Kubernetes - Part 4

$
0
0
Creating a Helm chart for an ASP.NET Core app

So far in this series I've provided a general introduction to Kubernetes. In this post we get more concrete: we'll create a Helm chart for deploying a small ASP.NET Core application to Kubernetes.

Note, as always, the advice in this post is based on my experience deploying ASP.NET Core apps using Helm. If you notice something I'm doing wrong or that could be made easier please let me know in the comments!

The sample app

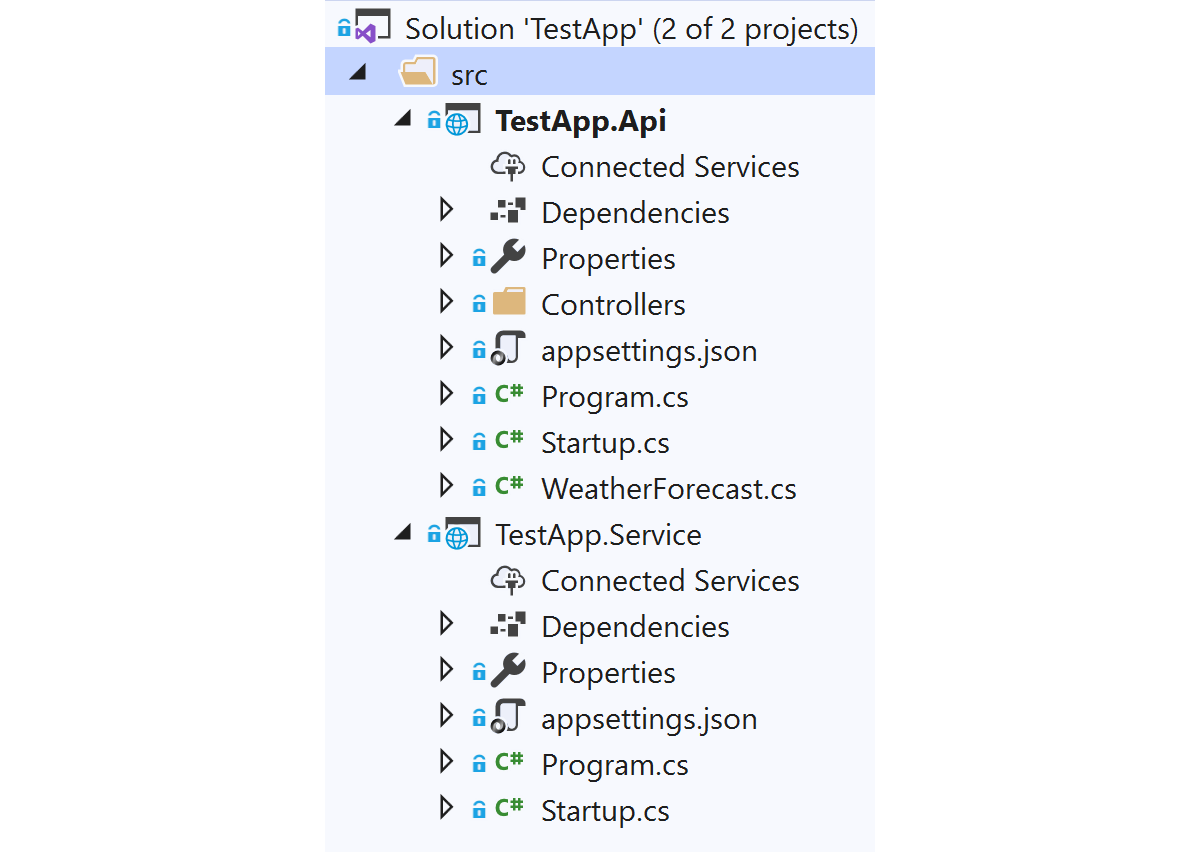
So that we have something concrete to work with, I've created a very basic .NET solution that consists of two projects:

The sample app consisting of two projects

  • TestApp.Api is an ASP.NET Core 3.1 app that uses API controllers (that might act as a backend for a mobile or SPA client-side app).
  • TestApp.Service is an ASP.NET Core app with no MVC components. This will run as a "headless" service, handling messages from an event queue using something like NServiceBus or MassTransit.

Note that for this example I'm using an ASP.NET Core application in both cases. TestApp.Service is a good candidate for using a "worker service" template that uses the generic Host without HTTP capabilities. Until recently there were good reasons for not using the generic host, but those have been resolved now. However I still generally favour using ASP.NET Core apps over worker services, as HTTP can be very handy for exposing health check endpoints for example.

The details of the solution aren't important here, I just wanted to show a Helm chart that includes multiple apps, one of which exposes a public HTTP endpoint, and one which doesn't.

As we're going to be deploying to Kubernetes, I also added a simple Dockerfile for each app, similar to the file below. This is a very basic example, but it'll do for our case.

FROM mcr.microsoft.com/dotnet/core/sdk:3.1-alpine3.12 AS build
WORKDIR /sln

# Copy project file and restore
COPY "./src/TestApp.Service/TestApp.Service.csproj" "./src/TestApp.Service/"
RUN dotnet restore ./src/TestApp.Service/TestApp.Service.csproj

# Copy the actual source code
COPY "./src/TestApp.Service" "./src/TestApp.Service"

# Build and publish the app
RUN dotnet publish "./src/TestApp.Service/TestApp.Service.csproj" -c Release -o /app/publish

#FINAL image
FROM mcr.microsoft.com/dotnet/core/aspnet:3.1-alpine3.12
WORKDIR /app
COPY --from=build /app/publish .
ENTRYPOINT ["dotnet", "TestApp.Service.dll"]

I build and tag the docker images for each app (for the Service app below) using

docker build -f TestApp.Service.Dockerfile -t andrewlock/my-test-service:0.1.0 .

This creates the image andrewlock/my-test-service:0.1.0 on my local machine. In practice, you'd push this up to a docker repository like DockerHub or ACR, but for now I'll keep them locally.

Now that we have an app to deploy (consisting of two separate services), we'll look at how to create a Helm chart for them.

Creating the default helm charts

We'll start off by creating a Helm chart using the helm CLI. Ensure that you've installed the command line and prerequisites, and have configured your local kubectl environment to point to a Kubernetes cluster.

If you're using the latest Helm, 3.0, then Tiller is no longer required.

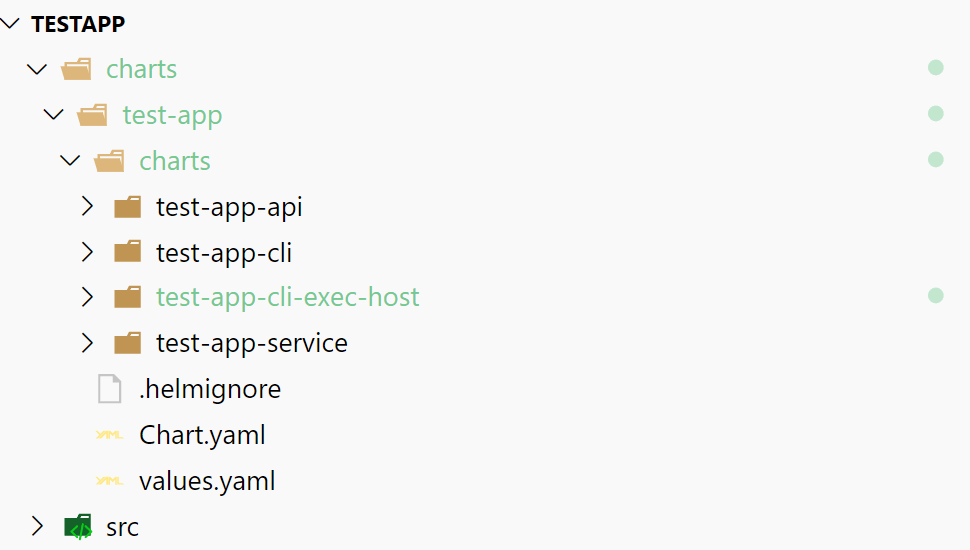
You can have helm scaffold a new chart for you by running helm create <chart name>. We'll create a new chart called test-app inside a solution-level directory cunningly named charts:

mkdir charts
cd charts
helm create test-app

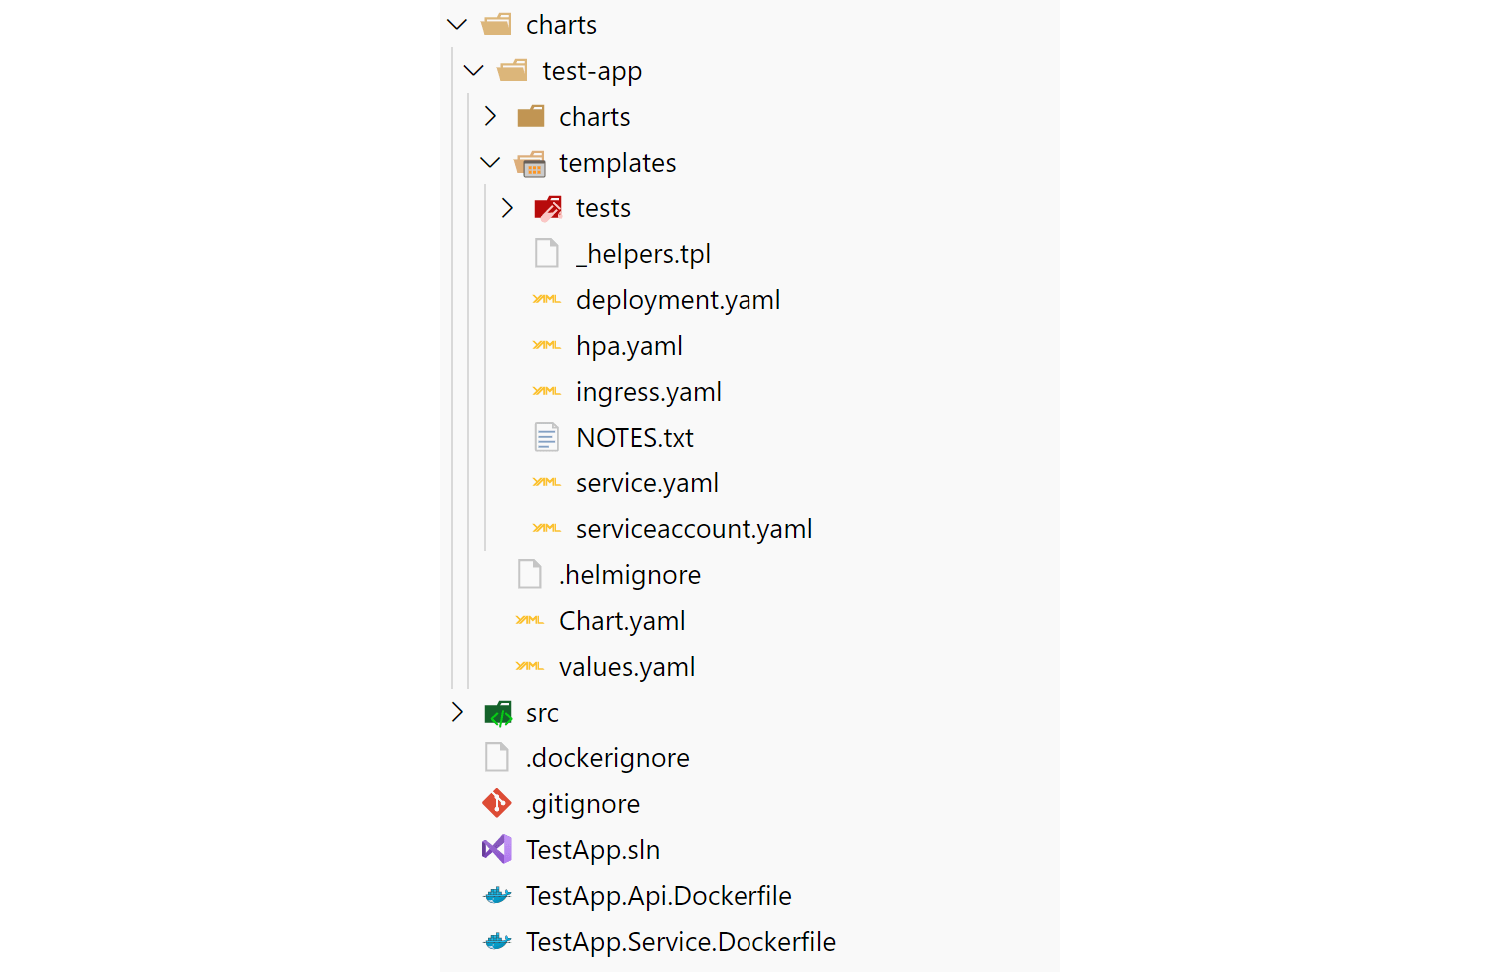
This will scaffold a new chart using best practices for chart naming, providing, among other things a values.yaml file for configuration, an ingress, a service, and a deployment for one application (a deployment of NGINX):

The File structure for the default template

There's a few important parts to this file structure:

  • The chart.yaml file includes the name, description, and version number of your app. It can also include various other metadata and requirements.
  • The values.yaml file includes default values for your application that can be overridden when your chart is deployed. This includes things like port numbers, host names, docker image names etc.
  • The templates folder is where the manifests that make up your chart are placed. In the sample chart the deployment, service, and ingress can be used to run an instance of NGINX.
  • The charts folder is empty in the sample, but it provides one way to manage dependencies on other charts, by creating "child" charts. I'll discuss this further below.

There are also manifests for two other resources I haven't discussed yet: a Horizontal Pod Autoscaler for the deployment, and a manifest to create a Service Account. There is also a manifest for running chart tests. I won't be discussing those manifests in this series.

The charts directory inside a Helm chart folder can be used for manually managing chart dependencies. The structure I like to have is a top-level chart for the solution, test-app in this example, and then sub-charts for each individual "app" that I want to deploy as part of the chart. So, to scaffold the charts for the sample solution that contains two apps, I'd run the following:

# Duplicated from above
mkdir charts
cd charts
helm create test-app

cd test-app
rm -r templates/* # Remove contents of top-level templates directory
cd charts

helm create test-app-api # Create a sub-chart for the API
helm create test-app-service # Create a sub-chart for the service

 # we don't need these files for sub-charts
rm test-app-api/.helmignore test-app-api/values.yaml
rm test-app-service/.helmignore test-app-service/values.yaml

# I'm not going to deal with these for now
rm test-app-api/templates/hpa.yaml test-app-api/templates/serviceaccount.yaml
rm test-app-service/templates/hpa.yaml test-app-service/templates/serviceaccount.yaml
rm -r test-app-api/templates/tests test-app-service/templates/tests

The end result is you have something that looks like this, with sub-charts for each app under a "top-level" chart:

File structure for nested solutions

There's both pros and cons to using this structure for applications:

  • You can deploy the "top-level" chart and it will deploy both the API and Service projects at the same time. This is convenient, but also assumes that's something you want to do. I'm assuming a level of "microservice" here that's scoped to the solution-level
  • You have a lot of version numbers now - there's a version for the top-level chart and a version for each sub-chart. Whenever one of the sub-charts change, you have to bump the version number of that and the top-level chart. Yes, it's as annoying as it sounds 🙁. It's quite possible there's a better solution here I'm not aware of…
  • You can share some configuration across all the sub-charts. Notice that we only have the "top-level" yaml.values file to contend with. We can provide sub-chart-specific configuration values from that file, as well as global files.

Tip: Don't include . in your chart names, and use lower case. It just makes everything easier later, trust me.

Updating the chart for your applications

If you browse the manifests that helm created, you'll see there's a lot of placeholders and settings. It can take a while to get used to them, but in most cases the templates are optionally setting values. For example, in the deployment.yaml file, in the spec section, you'll see:

spec:
  {{- with .Values.imagePullSecrets }}
  imagePullSecrets:
    {{- toYaml . | nindent 8 }}
  {{- end }}

This section tell Helm to check if the imagePullSecrets configuration value is provided. If it is, it writes any provided values out under the imagePullSecrets section, indenting appropriately (remember, YAML is white-space sensitive).

We're just going to make the most basic changes required to get our app deployed initially. The main change we need to make is to create separate sections in the top-level values.yaml file for our two sub-charts, test-app-api and test-app-service.

You can create the values.yaml files in the sub-chart folders if you prefer, but I prefer to manage all the default values in a single top-level values.yaml file.

values.yaml sets the default values used for deploying your chart, so you can include as little or as much as you like in here and override the values at install time. For now, I'm just going to configure the basics.

The yaml file below shows two separate sections, one for our test-app-api sub-chart, and one for our test-app-service sub-chart. Settings nested in these sections are applied to their respective charts.

test-app-api:
  replicaCount: 1

  image:
    repository: andrewlock/my-test-api
    pullPolicy: IfNotPresent
    tag: ""

  service:
    type: ClusterIP
    port: 80

  ingress:
    enabled: true
      nginx.ingress.kubernetes.io/rewrite-target: "/"
    hosts:
      - host: chart-example.local
        paths: 
        - "/my-test-app"

  autoscaling:
    enabled: false

  serviceAccount:
    create: false

test-app-service:
  replicaCount: 1

  image:
    repository: andrewlock/my-test-service
    pullPolicy: IfNotPresent
    tag: ""

  service:
    type: ClusterIP
    port: 80

  ingress:
    enabled: false

  autoscaling:
    enabled: false

  serviceAccount:
    create: false

Most of this should be fairly self-explanatory. In summary:

  • replicaCount: The number of replicas each deployment should have. We're only using a single replica for each service by default.
  • image: The Docker image + tag to use when deploying your app. I've not specified the tag here, as we'll set that at deploy time.
  • service: The configuration for the Kubernetes service. I've just used the defaults for this.
  • ingress: For the API, we specify the ingress details. We're going to be listening on the chart-example.local hostname, at the /my-test-app sub-path for our API. I also added the re-write annotation, so that the /my-test-app prefix is stripped from the request seen by the pod. We don't create an ingress for the backend service, as it doesn't have a public API.
  • autoscaling: We're not using autoscaling in this example
  • serviceAccount: Service accounts are for RBAC which I'm not going to discuss here.

Now you have a chart for your app, you can package it up and push it to a chart repository if you wish. I'm not going to cover that in this post, but it's something to bear in mind when setting up the CI/CD pipeline for your app. Are you going to store your charts in your application repository (I suggest you do), and how should you push updates?

Deploying a helm chart to Kubernetes

All of that work so far has been bootstrapping the chart for our application. Now it's time for the exciting bit—actually deploying the application to a cluster.

Typically you would do this by referencing a chart archive that has been pushed to a chart repository, in a manner analogous to Docker images and repositories. In this case, as we have the chart locally, we're going to install it directly from the charts/ directory.

Starting from the charts\test-app directory in your solution directory, run the following:

helm upgrade --install my-test-app-release . \
  --namespace=local \
  --set test-app-api.image.tag="0.1.0" \
  --set test-app-service.image.tag="0.1.0" \
  --debug \
  --dry-run

This does the following:

  • This creates (or upgrades an existing release) using the name my-test-app-release. I could have used helm install, but this keeps the command the same for subsequent deploys too - important if you come to use it in your deploy scripts.
  • This command ses the unpacked chart in the current directory (.). If we had pushed to a chart repository we'd use the name of the chart here (e.g. stable/redis).
  • I've specified that everything should be created in the local namespace I have in my Kubernetes cluster
  • I've overridden the test-app-api.image.tag value (which is currently blank in values.yaml), and the corresponding value in the service.
  • --debug enables verbose output, which can be handy if you have issues installing your charts.
  • --dry-run means we don't actually install anything. Instead, Helm shows you the manifests that would be generated, so you can check everything looks correct.

If you run the above command, you'll see a bunch of YAML dumped to the screen. That's what helm is going to deploy for you! It consists of a deployment for each app, a service for each app, and an ingress for the API app.

Image of the various resources created by the Helm chart
Helm creates a deployment of each service, with an associated service. We also specified that an ingress should be created for the my-test-api service

The --dry-run flag also shows the computed values that helm will use to deploy your chart, so you can check that the test-app-api.image.tag value in the previous command is set correctly, for example. Once you're happy with the YAML that will be generated, run the command again, omitting the --dry-run flag, and the chart will be deployed to your Kubernetes cluster.

This should produce output similar to the following, indicating that the resources were deployed

LAST DEPLOYED: Sat Aug 22 10:17:21 2020
NAMESPACE: local
STATUS: DEPLOYED

RESOURCES:
==> v1/Service
NAME                                  TYPE       CLUSTER-IP      EXTERNAL-IP  PORT(S)  AGE
my-test-app-release-test-app-api      ClusterIP  10.96.195.190   <none>       80/TCP   0s
my-test-app-release-test-app-service  ClusterIP  10.109.201.157  <none>       80/TCP   0s

==> v1/Deployment
NAME                                  DESIRED  CURRENT  UP-TO-DATE  AVAILABLE  AGE
my-test-app-release-test-app-api      1        1        1           0          0s
my-test-app-release-test-app-service  1        1        1           0          0s

==> v1beta1/Ingress
NAME                              HOSTS                ADDRESS  PORTS  AGE
my-test-app-release-test-app-api  chart-example.local  80       0s

==> v1/Pod(related)
NAME                                                   READY  STATUS             RESTARTS  AGE
my-test-app-release-test-app-api-77bfffc459-88xp6      0/1    ContainerCreating  0         0s
my-test-app-release-test-app-service-84df578b86-vv265  0/1    ContainerCreating  0         0s

If you have the Kubernetes dashboard installed in your cluster, you can wait for everything to turn green:

Deploying to Kubernetes

Once everything has finished deploying, it's time to take your service for a spin!

If you're following along, you need to ensure that both of your apps respond with a 200 status code to the path /. This is due to the liveness checks added to the Helm chart by default. I'll discuss these in detail in a future post

Testing the deployment

We deployed the TestApp.Api with a service and an ingress, so we can call the API from outside the cluster. We configured the API to use the hostname chart-example.local, and the path-prefix /my-test-app, so if we want to invoke the /weatherforecast endpoint exposed by our default API template, we need to send a request to: http://chart-example.local/my-test-app/weatherforecast:

curl http://chart-example.local/my-test-app/weatherforecast

[{"date":"2020-08-23T18:31:58.0426706+00:00","temperatureC":6,"temperatureF":42,"summary":"Freezing"},{"date":"2020-08-24T18:31:58.0426856+00:00","temperatureC":38,"temperatureF":100,"summary":"Warm"},{"date":"2020-08-25T18:31:58.0426859+00:00","temperatureC":-12,"temperatureF":11,"summary":"Mild"},{"date":"2020-08-26T18:31:58.042686+00:00","temperatureC":36,"temperatureF":96,"summary":"Warm"},{"date":"2020-08-27T18:31:58.0426861+00:00","temperatureC":-14,"temperatureF":7,"summary":"Bracing"}]

Obviously the hostname you use here has to point to your actual Kubernetes cluster. As I'm running a cluster locally, I added an entry to the /etc/hosts file.

We added the rewrite-annotation to the ingress, so that the TestApp.Api pod handling the request sees a different URL to the one we invoked, http://chart-example.local/weatherforecast, without the /my-test-app prefix. That's important in this case to make sure our app's routing works as expected. Without the rewrite annotation, the app would receive a request to /my-test-app/weatherforecast, which would return a 404.

You can view the logs for a pod either through the Kubernetes dashboard, or by using the kubectl command line. For example, the logs for our API app could be retrieved using the following command:

kubectl logs -n=local -l app.kubernetes.io/name=test-app-api

info: Microsoft.Hosting.Lifetime[0]
      Now listening on: http://[::]:80
info: Microsoft.Hosting.Lifetime[0]
      Application started. Press Ctrl+C to shut down.
info: Microsoft.Hosting.Lifetime[0]
      Hosting environment: Production
info: Microsoft.Hosting.Lifetime[0]
      Content root path: /app
warn: Microsoft.AspNetCore.HttpsPolicy.HttpsRedirectionMiddleware[3]
      Failed to determine the https port for redirect.

These are the standard startup logs for an ASP.NET Core application, but there's a couple of things to note:

  • We're running in the Production hosting environment. What if we want to specify that this is a Development or Staging environment?
  • Our app is only listening on port 80. But what about HTTPS? We're using the default ASP.NET Core API template that contains redirection middleware, so it's trying to redirect insecure requests, but our app doesn't know where to redirect them.

In the next post in the series, we'll look at how you can inject environment variables into your deployments, allowing you to control your app's configuration at deploy time.

Summary

In this post we created a Helm chart for an ASP.NET Core solution consisting of multiple apps. We created a top-level chart for the solution and added a sub-chart for each project. You saw how to update the values.yaml file for a chart to configure each sub-chart to set ports and, whether an ingress resource should be generated for example. You then deployed the chart to a cluster and tested it. In the next post, you'll see how to further customise your helm charts, by passing environment variables to your application pods.

Setting environment variables for ASP.NET Core apps in a Helm chart: Deploying ASP.NET Core applications to Kubernetes - Part 5

$
0
0
Setting environment variables for ASP.NET Core apps in a Helm chart

So far in this series I've provided a general introduction to Kubernetes and Helm, and we've deployed a basic ASP.NET Core solution using a Helm chart. In this post we extend the Helm chart to allow setting configuration values at deploy time, which are added to the application pods as environment variables.

The sample app: a quick refresher

In the previous post I described the .NET solution that we're deploying. It consists of two applications, TestApp.Api which is a default ASP.NET Core web API project, and a TestApp.Service which is an empty web project. The TestApp.Service represents a "headless" service, that would be handling messages from an event queue using something like NServiceBus or MassTransit.

The sample app consisting of two projects

We created Docker images for both of these apps, and created a Helm chart for the solution, that consists of a "top-level" Helm chart test-app containing two sub-charts (test-app-api and test-app-service).

File structure for nested solutions

When installed, these charts create a deployment for each app, a service for each app, and an ingress for the test-app-api only.

Image of the various resources created by the Helm chart
Helm creates a deployment of each app, with an associated service. We also specified that an ingress should be created for the my-test-api service

In the previous post, we saw how to control various settings of the Helm chart by adding values to the Chart's values.yaml file, and also at install-time, by passing --set key=value to the helm upgrade --install command.

We used this approach to set various Kubernetes and Helm related values (what service types to use, which ports to expose etc.) but we didn't change anything in our application. In this post, we want to override configuration in our ASP.NET Core apps, for example to change the HostingEnvironment our apps are using.

Setting pod environment variables in a deployment manifest

In the previous post, when we checked the logs for our API app, we noticed that it was using the default hosting environment, Production, and that it had not been configured to handle HTTPS redirection correctly.

kubectl logs -n=local -l app.kubernetes.io/name=test-app-api

info: Microsoft.Hosting.Lifetime[0]
      Now listening on: http://[::]:80
info: Microsoft.Hosting.Lifetime[0]
      Application started. Press Ctrl+C to shut down.
info: Microsoft.Hosting.Lifetime[0]
      Hosting environment: Production # The default environment
info: Microsoft.Hosting.Lifetime[0]
      Content root path: /app
warn: Microsoft.AspNetCore.HttpsPolicy.HttpsRedirectionMiddleware[3]
      Failed to determine the https port for redirect.  # The app doesn't know how to redirect from HTTP -> HTTPS

We're deploying to a test environment at the moment, so we want to change the hosting environment to Staging. We'll also let the NGINX ingress controller handle SSL/TLS offloading, so we want to ensure our app uses the correct X-Forwarded-Proto headers to understand whether the original request came over HTTP or HTTPS

When you're deploying in a reverse-proxy environment such as in Kubernetes, it's important you configure the ForwardedHeadersMiddleware and options. This enables things like SSL/TLS offloading (as I'm using), where the application sends HTTPS requests to the ingress, but the ingress forwards the request to your deployment using HTTP. Setting forwarded headers tells your application the original request was over HTTPS.

You can set environment variables in pods by adding an env: dictionary to the deployment.yaml manifest. For example, in the following manifest, I've added an env section underneath the test-app-api container in the spec:containers section.

I find lots of YAML really hard work to look at, but I've included a whole manifest here because it's vital that you get the white-space and indentation correct. Errors in white-space a nightmare to debug!

apiVersion: apps/v1
kind: Deployment
metadata:
  name: test-app-api-deployment
spec:
  replicas: 3
  strategy: 
    type: RollingUpdate
  selector:
    matchLabels:
      app: test-app-api
  template:
    metadata:
      labels:
        app: test-app-api
    spec:
      containers:
      - name: test-app-api
        image: andrewlock/my-test-api:0.1.1
        ports:
        - containerPort: 80
        # Environment variable section
        env:
        - name: "ASPNETCORE_ENVIRONMENT"
          value: "Staging"
        - name: "ASPNETCORE_FORWARDEDHEADERS_ENABLED"
          value: "true"

In the above example, I've added two environment variables - one setting the ASPNETCORE_ENVIRONMENT variable, which controls the application's HostingEnvironment, and one which enables the ForwardedHeaders middleware, so the application knows it's behind a reverse-proxy (in this case an NGINX ingress controller).

The ASPNETCORE_FORWARDEDHEADERS_ENABLED environment variable is an easy way to configure the middleware, when you're sure your application is behind a trusted proxy.

If we install that manifest and check the logs, we'll see that the hosting environment has changed to Staging:

kubectl logs -n=local -l app.kubernetes.io/name=test-app-api

info: Microsoft.Hosting.Lifetime[0]
      Now listening on: http://[::]:80
info: Microsoft.Hosting.Lifetime[0]
      Application started. Press Ctrl+C to shut down.
info: Microsoft.Hosting.Lifetime[0]
      Hosting environment: Staging # Updated to staging
info: Microsoft.Hosting.Lifetime[0]
      Content root path: /app
warn: Microsoft.AspNetCore.HttpsPolicy.HttpsRedirectionMiddleware[3]
      Failed to determine the https port for redirect.

You'll notice that we still have the "Failed to determine the https port for redirect". You can resolve this by setting the ASPNETCORE_HTTPS_PORT variable. I've avoided doing that here, as it causes issues with the liveness probes, which we discuss in later posts.

In the above example we've hard-corded the environment variable configuration into the deployment.yaml manifest. In practice, we want to provide these values at install time so we should use Helm's support for templating and injecting values.

Setting environment variables using Helm variables

First, lets update the deployment.yaml Helm template to use values provided at install time. I'm not going to reproduce the whole template here, just the bits we're interested in. Again, make sure you get the indentation right when you add it to your manifest!

apiVersion: apps/v1
kind: Deployment
metadata:
  name: test-app-api-deployment
spec:
  template:
    spec:
      containers:
      - name: test-app-api
        image: andrewlock/my-test-api:0.1.1
        # Environment variable section
        env:
        {{ range $k, $v := .Values.env }}
          - name: {{ $k | quote }}
            value: {{ $v | quote }}
        {{- end }}

The important part is those last 4 lines. That syntax says

  • Retrieve .Values.env, that is, the env section of the current Helm values (the values provided in values.yaml merged with the values provided using the --set syntax at install time)
  • The env section should be a dictionary/map structure. Repeat the content inside the {{range}} {{- end}} block for each key-value-pair.
  • For each key-value pair, assign the key to $k and the value to $v.
  • {{ $k | quote }} means "print the variable $k, adding quote (") marks as necessary".

That means we can set values in values.yaml using, for example:

# config for test-app-api 
test-app-api:

  env: 
    "ASPNETCORE_ENVIRONMENT": "Staging"
    "ASPNETCORE_FORWARDEDHEADERS_ENABLED": "true"

  image:
    repository: andrewlock/my-test-api

  # ... other config

# config for test-app-service
test-app-service:

  env: 
    "ASPNETCORE_ENVIRONMENT": "Staging"
    "ASPNETCORE_FORWARDEDHEADERS_ENABLED": "true"

  image:
    repository: andrewlock/my-test-service

  # ... other config

At install time, the template gets rendered as the following:

spec:
  template:
    spec:
      containers:
      - name: test-app-api
        image: andrewlock/my-test-api:0.1.1
        env:
          - name: "ASPNETCORE_ENVIRONMENT"
            value: "Staging"
          - name: "ASPNETCORE_FORWARDEDHEADERS_ENABLED"
            value: "true"

You can also set/override the environment variables using --set arguments in your helm upgrade --install command, for example:

helm upgrade --install my-test-app-release . \
  --namespace=local \
  --set test-app-api.image.tag="0.1.0" \
  --set test-app-service.image.tag="0.1.0" \
  --set test-app-api.env.ASPNETCORE_ENVIRONMENT="Staging" \
  --set test-app-service.env.ASPNETCORE_ENVIRONMENT="Staging"

Of course, there's an obvious annoyance here—we're having to duplicate environment variables for each service, even though we want the exact same values. Luckily, there's an easy way around that using global values.

Using global values to reduce duplication

Helm's global values are exactly what they sound like: they're values you set globally that all sub-charts can access. The values you've seen so far have all been scoped to a specific chart by using a test-app-api: or test-app-service: section in values.yaml. Global values are set at the top-level. For example, if we use global values for our env configuration, then we could just specify them once in values.yaml, in the global: section:

# global config
global:
  env: 
    "ASPNETCORE_ENVIRONMENT": "Staging"
    "ASPNETCORE_FORWARDEDHEADERS_ENABLED": "true"

# config for test-app-api 
test-app-api:
  image:
    repository: andrewlock/my-test-api

  # ... other app-specific config

# config for test-app-service
test-app-service:
  image:
    repository: andrewlock/my-test-service

  # ... other app-specific config

These values are added to a global variable under .Values, so to use these values in our sub-charts, we need to update the manifests to use .Values.global.env instead of .Values.env:

apiVersion: apps/v1
kind: Deployment
metadata:
  name: test-app-api-deployment
spec:
  template:
    spec:
      containers:
      - name: test-app-api
        image: andrewlock/my-test-api:0.1.1
        env:
        {{ range $k, $v := .Values.global.env }} # instead of .Values.env
          - name: {{ $k | quote }}
            value: {{ $v | quote }}
        {{- end }}

At install time, you can override these values as before using --set global.env.key="value" (note the global. prefix). For example:

helm upgrade --install my-test-app-release . \
  --namespace=local \
  --set test-app-api.image.tag="0.1.0" \
  --set test-app-service.image.tag="0.1.0" \
  --set global.env.ASPNETCORE_ENVIRONMENT="Staging" 

That's definitely better, but what if you want the best of both worlds? You want to be able to globally set environment variables, but you want to be able to set/override them for specific apps too. On the face of it, it seems like you can just combine both of the techniques above, but doing that naïvely can give strange errors…

Merging global and sub-chart-specific values: the wrong way

As an example of the problem, lets imagine you want to be able to set a global value, and override it at the sub-chart level. You might update the template section of your manifest to this:

env:
{{ range $k, $v := .Values.global.env }} # global variables
  - name: {{ $k | quote }}
    value: {{ $v | quote }}
{{- end }}
{{ range $k, $v := .Values.env }} # sub-chart variables
  - name: {{ $k | quote }}
    value: {{ $v | quote }}
{{- end }}

and set different global and sub-chart values at install time:

helm upgrade --install my-test-app-release . \
  --namespace=local \
  --set global.env.ASPNETCORE_ENVIRONMENT="Staging" \          # global value
  --set test-app-api.env.ASPNETCORE_ENVIRONMENT="Development"  # sub-chart value

Unfortunately, the way we've designed our manifest means that we don't get "override" semantics. Instead, you will end up setting the environment variable twice, with two different values:

env:
  - name: "ASPNETCORE_ENVIRONMENT"
    value: "Staging"
  - name: "ASPNETCORE_ENVIRONMENT"
    value: "Development"

Unfortunately, this gives a horrendously, confusing error message, which only seems to appear when you update a chart

Error: UPGRADE FAILED: The order in patch list:
[map[name:ASPNETCORE_ENVIRONMENT value:Staging] map[name:ASPNETCORE_ENVIRONMENT value:Development] map[name:ASPNETCORE_FORWARDEDHEADERS_ENABLED value:true]]
 doesn't match $setElementOrder list:
[map[name:ASPNETCORE_ENVIRONMENT] map[ASPNETCORE_FORWARDEDHEADERS_ENABLED]]

In this very basic example, you might figure it out, but I'd be impressed! One way around this is the manual approach of avoiding setting global variables if you set them for sub-charts. That works around the issue but isn't particularly user friendly.

Instead, you can use a bit of dictionary manipulation to correctly merge the values in the two dictionaries before you write them in your manifest

Merging global and sub-chart specific variables: the right way

To solve our problem we're going to use a function from an underlying package, sprig, that helm uses to provide the templating functionality. In particular, we're going to use the dict function, to create an empty dictionary, and the merge function, to merge two dictionaries.

Update your deployment.yaml manifests to the following:

env:
{{- $env := merge (.Values.env | default dict) (.Values.global.env | default dict) -}}
{{ range $k, $v := $env }}
  - name: {{ $k | quote }}
    value: {{ $v | quote }}
{{- end }}

This does the following:

  • {{- $env := ... -}} Defines a variable $env, which will be the final dictionary containing the variables we want to merge
  • (.Values.env | default dict) use the values provided in the env: section. If that section doesn't exist, create an empty dictionary instead.
  • (.Values.global.env | default dict) as above, but for the global values.
  • merge a b Merge the values of b into a. The order is important here—keys in a will not be overridden if they appear in b too, so we need a to be the most specific values, and b to be the most general values.

With this configuration, you can now set values globally and override them for specific sub-charts:

helm upgrade --install my-test-app-release . \
  --namespace=local \
  --set global.env.ASPNETCORE_ENVIRONMENT="Staging" \          # global value
  --set test-app-api.env.ASPNETCORE_ENVIRONMENT="Development"  # sub-chart value

For the test-app-api sub-chart, that now renders (correctly) as:

env:
  - name: "ASPNETCORE_ENVIRONMENT"
    value: "Development"

Setting environment variables like this is the preferred way for getting configuration values into your app when you're deploying in Kubernetes. You can still use appsettings.json for "static" configuration, but for any configuration that is environment specific, environment variables are the way to go.

Injecting secrets into your apps is a whole other aspect, as it can be tricky to do safely! I've blogged previously about using AWS Secrets Manager directly from your apps, but there are also (complicated) approaches which plug directly into Kubernetes.

The approach we've seen so far is great for setting environment variables when the configuration values are known at the time you install the chart. But in some situations, your app might need to know details about its configuration in the Kubernetes environment, such as its IP address. For those circumstances, you'll need a slightly different configuration.

Exposing pod information to your applications

When Kubernetes runs your application in a pod, it knows various things about your pod, for example:

  • The name of the Node it's running on
  • What service account it's running under
  • The IP Address of the pod
  • The IP Address of the host Node

In most cases, your application shouldn't care about those values. Ideally, your application should need to know as little about its environment as possible.

However, in some cases, you may find you need to access these values. One example might be that you're running DataDog's StatsD agent on a Node, and you need to set the IP address in your application's config.

There are obviously multiple ways to obtain metrics from your app, and this isn't necessarily the best one, it's just an example!

You can "inject" values that Kubernetes knows about a pod as environment variables into your pod. This uses a similar syntax the -name/value configuration you've already seen, but it uses valueFrom instead. For example:

apiVersion: apps/v1
kind: Deployment
metadata:
  name: test-app-api-deployment
spec:
  template:
    spec:
      containers:
      - name: test-app-api
        image: andrewlock/my-test-api:0.1.1
        env:
          - name: "ASPNETCORE_ENVIRONMENT"
            value: "Development"             # A "static" value
          - name: "MyPodIp"
            valueFrom: 
              fieldRef: 
                fieldPath: status.hostIP     # A dynamic variable, set when the pod is provisioned

In the example above, the pod will have two environment variables:

  • ASPNETCORE_ENVIRONMENT is set "statically" using the value provided in the manifest. You can also use a static value using set when calling helm upgrade --install, by using the templating approach I've already described
  • MyPodIp is set to the host Node's IP address, This is set dynamically when the pod is created. Different pods in the same deployment may have different values if they're deployed on different Nodes.

There are a variety of different values available, sourced from the manifest used to deploy the pod or from runtime values taken from status. The only ones I've used personally are status.hostIP to get the host Node's IP address, and status.podIP to get the pod's IP address.

You can read more about this approach in the documentation. This also shows how to inject container-specific values, in addition to pod-specific values.

Rather than hard-coding values and mappings into your deployment.yaml manifest, as I did above, it's better to use Helm's templating capabilities to extract this into configuration. We can use a similar approach as I showed in previous sections to create envValuesFrom sections, which define an environment variable-to-fieldPath mapping. For example:

env:
{{ range $k, $v := .Values.global.envValuesFrom }}
  - name: {{ $k | quote }}
    valueFrom:
      fieldRef:
        fieldPath: {{ $v | quote }}
{{- end }}

You could then create a mapping between the Runtime__IpAddress environment variable and the status.podIP field by using the following configuration in your values.yaml (or alternatively using --set when installing the chart):

global:
  # Environment variables shared between all the pods, populated with valueFrom: fieldRef
  envValuesFrom:
    Runtime__IpAddress: status.podIP

Note that I've used the double underscore __ in the environment variable name. The translates to a "section" in ASP.NET Core's configuration, so this would set the configuration value Runtime:IpAdress to the pod's IP address.

When Helm renders the manifest, it will create an env section like the following:

env:
  - name: "Runtime__IpAddress"
    valueFrom: 
      fieldRef: 
        fieldPath: "status.podIP"

You can allow "overriding" envValuesFrom using the same dictionary-merging technique I described previously, but I've not found much of a need for that personally. You can also use envValuesFrom in conjunction with env to give a combination of static and dynamic environment variables. I typically just render both lists in my manifest—I don't use envValuesFrom very often, and there's never been any overlap with env values:

env:
{{ range $k, $v := .Values.global.envValuesFrom }} # dynamic values
  - name: {{ $k | quote }}
    valueFrom:
      fieldRef:
        fieldPath: {{ $v | quote }}
{{- end }}

{{- $env := merge (.Values.env | default dict) (.Values.global.env | default dict) -}} # static values, merged together
{{ range $k, $v := $env }}
  - name: {{ $k | quote }}
    value: {{ $v | quote }}
{{- end }}

That covers how I handle injecting configuration into ASP.NET Core applications when installing helm charts. In the next post we'll cover another important aspect: liveness probes.

Summary

In this post I showed how you can use Helm values to inject values into your ASP.NET Core applications as environment variables. I showed how to use templating so that you can set these values at runtime, and how to reduce duplication by using global values. I also showed how to safely combine global and sub-chart-specific values using the merge function. Finally, I showed how to inject dynamic environment variables, such as a pod's IP address, using the valueFrom syntax.

Adding health checks with Liveness, Readiness, and Startup probes: Deploying ASP.NET Core applications to Kubernetes - Part 6

$
0
0
Adding health checks with Liveness, Readiness, and Startup probes

In previous posts in this series you've seen how to deploy an ASP.NET Core application to Kubernetes using Helm, and how to configure your applications by injecting environment variables.

In this post I'm going to talk about a crucial part of Kubernetes—health checks. Health checks indicate when your application has crashed and when it is ready to receive traffic, and they're a crucial part of how Kubernetes manages your application.

In this post I'll discuss how Kubernetes uses health checks to control deployments, and how to add them to your ASP.NET Core applications. I'll also discuss "smart" vs "dumb" health checks, which ones I think you should use, and one of the gotchas that tripped me up when I started deploying to Kubernetes.

Kubernetes deployments and probes

As I discussed in the first post in this series, Kubernetes is an orchestrator for your Docker containers. You tell it which containers you want to run in a pod, and how many replicas of the pod it should create by creating a Deployment resource. Kubernetes tries to ensure there's always the required number of instances of your pod running in the cluster by starting up new instances as required.

Kubernetes obviously can tell how many instances of your pod it's running, but it also needs to know if your application has crashed, or if it has deadlocked. If it detects a crash, then it will stop the pod and start up a new one to replace it.

But how does Kubernetes know if your app has crashed/deadlocked? Sure, if the process dies, that's easy; Kubernetes will automatically spin up another instance. But what about the more subtle cases:

  • The process hasn't completely crashed, but it's deadlocked and not running any more
  • The application isn't technically deadlocked, but it can't handle any requests

Kubernetes achieves this using probes.

The three kinds of probe: Liveness, Readiness, and Startup probes

Kubernetes (since version 1.16) has three types of probe, which are used for three different purposes:

  • Liveness probe. This is for detecting whether the application process has crashed/deadlocked. If a liveness probe fails, Kubernetes will stop the pod, and create a new one.
  • Readiness probe. This is for detecting whether the application is ready to handle requests. If a readiness probe fails, Kubernetes will leave the pod running, but won't send any requests to the pod.
  • Startup probe. This is used when the container starts up, to indicate that it's ready. Once the startup probe succeeds, Kubernetes switches to using the liveness probe to determine if the application is alive. This probe was introduced in Kubernetes version 1.16.

To add some context, in most applications a "probe" is an HTTP endpoint. If the endpoint returns a status code from 200 to 399, the probe is successful. Anything else is considered a failure. There are other types of probe (TCP/generic command) but I'm not going to cover those in this post.

Having three different types of probe might seem a bit over the top, but they do subtly different things. If flow charts are your thing, this is an overview of the interplay between them:

Flow chart of probes in kubernetes
The interplay between different health-check probes in Kubernetes.

We'll look at each of these probes in turn.

Startup probes

The first probe to run is the Startup probe. When your app starts up, it might need to do a lot of work. It might need to fetch data from remote services, load dlls from plugins, who knows what else. During that process, your app should either not respond to requests, or if it does, it should return a status code of 400 or higher. Once the startup process has finished, you can switch to returning a success result (200) for the startup probe.

As soon as the startup probe succeeds once it never runs again for the lifetime of that container. If the startup probe never succeeds, Kubernetes will eventually kill the container, and restart the pod.

Startup probes are defined in your deployment.yaml manifest. For example, the following shows the spec:template: section for a deployment.yaml that contains a startup probe. The probe is defined in startupProbe, and calls the URL /health/startup on port 80. It also states the probe should be tried 30 times before failing, with a wait period of 10s between checks.

apiVersion: apps/v1
kind: Deployment
metadata:
  name: test-app-api-deployment
spec:
  template:
    metadata:
      labels:
        app: test-app-api
    spec:
      containers:
      - name: test-app-api
        image: andrewlock/my-test-api:0.1.1
        startupProbe:
          httpGet:
            path: /health/startup
            port: 80
          failureThreshold: 30
          periodSeconds: 10

You can add more configuration to the HTTP probe, such as specifying that HTTPS should be used and custom headers to add. You can also add additional configuration around the probe limits, such as requiring multiple successful attempts before the probe is configured "successful".

Once the startup probe succeeds, Kubernetes starts the liveness and readiness probes.

Liveness probes

The liveness probe is what you might expect—it indicates whether the container is alive or not. If a container fails its liveness probe, Kubernetes will kill the pod and restart another.

If you have multiple containers in a pod, then if any of the containers fail their liveness probes then the whole pod is killed and restarted.

Liveness probes are defined in virtually the same way as startup probes, in deployment.yaml. The following shows an HTTP liveness probe that calls the path /healthz on port 80.

apiVersion: apps/v1
kind: Deployment
metadata:
  name: test-app-api-deployment
spec:
  template:
    metadata:
      labels:
        app: test-app-api
    spec:
      containers:
      - name: test-app-api
        image: andrewlock/my-test-api:0.1.1
        livenessProbe:
          httpGet:
            path: /healthz
            port: 80
          initialDelaySeconds: 0
          periodSeconds: 10
          timeoutSeconds: 1
          failureThreshold: 3

The specification above shows some additional configuration values (the default values). initialDelaySeconds controls whether liveness checks start immediately, and periodSeconds defines the waiting period between checks. timeoutSeconds is how long before a request times out if your application isn't handling requests, and failureThreshold is the number of times a request can fail before the probe is considered "failed". Based on the configuration provided, that means if a pod isn't handling requests, it will take approximately 30s (periodSeconds × failureThreshold) before Kubernetes restarts the pod.

As you might expect, liveness probes happen continually through the lifetime of your app. If your app stops responding at some point, Kubernetes will kill it and start a new instance of the pod.

Readiness probes

Readiness probes indicate whether your application is ready to handle requests. It could be that your application is alive, but that it just can't handle HTTP traffic. In that case, Kubernetes won't kill the container, but it will stop sending it requests. In practical terms, that means the pod is removed from an associated service's "pool" of pods that are handling requests, by marking the pod as "Unready".

Readiness probes are defined in much the same way as startup and liveness probes:

apiVersion: apps/v1
kind: Deployment
metadata:
  name: test-app-api-deployment
spec:
  template:
    metadata:
      labels:
        app: test-app-api
    spec:
      containers:
      - name: test-app-api
        image: andrewlock/my-test-api:0.1.1
        readinessProbe:
          httpGet:
            path: /ready
            port: 80
          successThreshold: 3

Configuration settings are similar for readiness probes, though you can also set the successThreshold, which is the number of consecutive times a request must be successful after a failure before the probe is considered successful.

An important point about readiness probes, which is often overlooked, is that readiness probes happen continually through the lifetime of your app, exactly the same as for liveness probes. We'll come back to this shortly, but for now, lets add some endpoints to our test application to act as probes.

Health checks in ASP.NET Core

ASP.NET Core introduced health checks in .NET Core 2.2. This provides a number of services and helper endpoints to expose the state of your application to outside services. For this post, I'm going to assume you have some familiarity with ASP.NET Core's health checks, and just give a brief overview here.

Jürgen Gutsch has a great look at Health Checks in ASP.NET Core here.

If you're adding health checks to an ASP.NET Core application, I strongly suggest looking at AspNetCore.Diagnostics.HealthChecks by the folks at Xabaril. They have a huge number of health checks available for checking that your app can connect to your database, message bus, Redis, Elasticsearch; you name it, they have a check for it!

Despite that, just for demonstration purposes, I'm going to create a very simple custom health check for our application. It's not going to be especially useful, but it shows how you can create your own IHealthCheck implementations. I'll also use it to demonstrate a separate point later.

Creating a custom health check

To create a custom HealthCheck, you should implement IHealthCheck in the namespace Microsoft.Extensions.Diagnostics.HealthChecks. The example below simply returns a healthy or unhealthy result based on a random number generator. This check only returns healthy 1/5 times, the rest of the time it returns unhealthy.

public class RandomHealthCheck : IHealthCheck
{
    private static readonly Random _rnd = new Random();

    public Task<HealthCheckResult> CheckHealthAsync(HealthCheckContext context, CancellationToken cancellationToken = default)
    {
        var result = _rnd.Next(5) == 0
            ? HealthCheckResult.Healthy()
            : HealthCheckResult.Unhealthy("Failed random");

        return Task.FromResult(result);
    }
}

There's a couple of things to note here:

  • The method can be async, though I don't need that for this example.
  • You can return extra data in both the Healthy and Unhealthy check results such as a description, Exception, or arbitrary extra data. This can be very useful for building dashboards, such as the Health Checks UI, also from Xabaril.

You can register the service in Startup.ConfigureServices() when you add the health check services to your application, giving the check a name e.g. "Main database", "Redis cache", or, in this case "Random check":

public void ConfigureServices(IServiceCollection services)
{
    services.AddHealthChecks()
        .AddCheck<RandomHealthCheck>("Random check");

    services.AddControllers(); // Existing configuration
}

Now we need to add health check endpoints for the various probes. As an example, I'm going to add separate endpoints for each probe, using the paths defined earlier in this post.

public void Configure(IApplicationBuilder app, IWebHostEnvironment env)
{
    app.UseHttpsRedirection();
    app.UseRouting();
    app.UseAuthorization();

    app.UseEndpoints(endpoints =>
    {
        endpoints.MapHealthChecks("/health/startup");
        endpoints.MapHealthChecks("/healthz");
        endpoints.MapHealthChecks("/ready");
        endpoints.MapControllers();
    });
}

When you hit any of these endpoints, the configured health checks are executed, and will return either a Healthy or Unhealthy result. If the checks are healthy, ASP.NET Core will return a 200 result, which will cause the probe to succeed. If any of the checks fail, we return a 503 result, and the probe will fail.

You can test these health checks locally. Run the application, hit one of the health check endpoints, and keep refreshing. You'll see the response switch between healthy and unhealthy.

Random health check return Healthy and Unhealthy response

It's important to remember that endpoints only execute after everything earlier in the middleware pipeline. In the code above, the HttpsRedirection middleware will cause non-HTTPS endpoints to return a 307 Temporary Redirect, which will be seen as a success by the probe.

The health check I've created is obviously not very useful, but it brings us to the crux of a somewhat philosophical question: when do we want our health checks to fail?

Smart vs Dumb health checks

That might seem like a silly question. If we have a health check for checking our app can connect to the database, then if that check fails, the health check should fail right? Well, not necessarily.

Imagine you have many services, all running in Kubernetes, and which have some dependencies on each other.

Image of a microservice architecture

Having your services so directly dependent on one another, rather than indirectly connected via a message bus or broker is probably a bad idea, but also probably not that unusual. This is obviously an oversimplified example, to get the point across.

For simplicity, lets also imagine that each service contains a single liveness probe which verifies that a service can connect to all the other services it depends on.

Now imagine the network connection between "Service X" (bottom right) and the database has a blip, and the app loses connectivity. This happens for about 30s, before the connection re-establishes itself.

However, that 30s is sufficient for the liveness probe to fail, and for Kubernetes to restart the application. But now Service Y can't connect to Service X, so its liveness probe fails too, and k8s restarts that one. Continue the pattern, and you've got a cascading failure across all your services, caused by a blip in connectivity in just one service, even though most of the services don't depend on the service that failed (the database).

There's generally two different approaches to how to design your probes:

  • Smart probes typically aim to verify the application is working correctly, that it can service requests, and that it can connect to its dependencies (a database, message queue, or other API, for example).
  • Dumb health checks typically only indicate the application has not crashed. They don't check that the application can connect to its dependencies, and often only exercise the most basic requirements of the application itself i.e. can they respond to an HTTP request.

On the face of it, smart health checks seem like the "better" option, as they give a much better indication that your application is working correctly. But they can be dangerous, as you've seen. So how do we strike that balance?

Dumb liveness checks, smart startup checks

The approach I favour is:

  • Use dumb liveness probes
  • Use smart startup probes
  • Readiness probes…we'll get to them shortly

For liveness checks, dumb health checks definitely seem like the way to go. You can argue how dumb, but fundamentally you just want to know whether the application is alive. Think of it like a "restart me now" flag. If restarting the app won't "fix" the health check, it probably shouldn't be in the liveness check. For the most part, that means if Kestrel can handle the request, the health check should pass.

For startup checks, I take the opposite approach. This is where I do all my due-diligence for the application: check you can connect to the database or to a message bus, and that the app's configuration is valid.

Generally speaking startup is also the best and safest time to do these checks. In my experience, failures are most often due to a configuration change—when you're deploying in Kubernetes that's invariably due to a configuration error. Checking this once at startup is the best place for it.

This can still lead to issues if your services rely on the health of other services. If you need to do a big redeploy for some reason, you can get "stuck" where every service is waiting for another one. This normally points to a problem in your application architecture,and should probably be addressed, but it's something to watch out for.

So that brings us to readiness checks. And honestly, I don't know what to suggest. For most API applications I struggle to think of a situation where the application is still alive and handling requests (as checked by the liveness probe), has finished its startup checks (as checked by the startup probe), but shouldn't be receiving traffic (which would be indicated by the readiness probe). The main candidate situation would be where the app is overloaded with requests, and needs to process them, but personally that's not a situation I've had to handle in this way.

As I've already described, we probably shouldn't be checking the availability of our dependencies in readiness checks due to the potential for cascading failures. You could take applications out of circulation based on CPU utilization or RPS, but that seems very fragile to me. On top of that, readiness probes are executed throughout the lifetime of the application, so they shouldn't be heavy or they'll be adding unnecessary load to the app itself.

I'd be interested to know what people are checking their readiness checks so please let me know in the comments!

So now we know what we want—dumb liveness checks and smart startup checks—let's update our application's implementation.

Executing a subset of health checks in a health check endpoint

For our liveness probe we only want to do the bare minimum of checks. You can still use the health check endpoint for this, as the MapHealthChecks() method has an overload that allows you to pass a predicate for whether a health check should be executed. We simply pass a predicate which always returns false, so the RandomHealthCheck we registered won't be executed.

public void Configure(IApplicationBuilder app, IWebHostEnvironment env)
{
    app.UseHttpsRedirection();
    app.UseRouting();
    app.UseAuthorization();

    app.UseEndpoints(endpoints =>
    {
        endpoints.MapHealthChecks("/health/startup");
        endpoints.MapHealthChecks("/healthz", new HealthCheckOptions { Predicate = _ => false });
        endpoints.MapHealthChecks("/ready", new HealthCheckOptions { Predicate = _ => false });
        endpoints.MapControllers();
    });
}

I've also added the predicate to the /ready endpoint, so that we still expose a readiness probe, but we could feasibly omit that, given a failure here will cause the liveness probe to fail anyway.

If we deploy our helm chart to Kubernetes, we might find it takes a little longer for our services to be ready, while we wait for the RandomHealthCheck to return Healthy (simulating real health checks you might run on startup). Once the app is deployed however, it will remain available as long as Kestrel doesn't outright crash! Which means forever 😉

Summary

In this post I described why Kubernetes uses health check probes and the three types of probe available. I showed how to configure these in your deployment.yaml and what each probe is for. I also showed how to create a custom health check, how to register it in your application and expose health check endpoints.

When creating health checks you have the option of creating "smart" health checks, that check that an app is perfectly healthy, including all its dependencies, or "dumb" health checks, that check the application simply hasn't crashed. I suggest you use smart health checks for your startup probe, primarily to catch configuration errors. I suggest you use dumb health checks for liveness probes, to avoid cascading failures.


Running database migrations when deploying to Kubernetes: Deploying ASP.NET Core applications to Kubernetes - Part 7

$
0
0
Running database migrations when deploying to Kubernetes

In this post I deal with a classic thorny issue that quickly arises when you deploy to a highly-replicated production environment: database migrations.

I discuss various possible solutions to the problem, including simple options as well as more complex approaches. Finally I discuss the approach that I've settled on in production: using Kubernetes Jobs and init containers. With the proposed solution (and careful database schema design!) you can perform rolling updates of your application that includes database migrations.

The classic problem: an evolving database

The problem is very common—the new version of your app uses a slightly different database schema to the previous version. When you deploy your app, you need to also update the database. Theses are commonly called database migrations, and are a reality for any evolving application.

There are many different approaches to creating those database migrations. EF Core, for example, automatically generates migrations to evolve your database. Alternatively, there are libraries you can use such as DbUp or FluentMigrator that allow you to define your migrations in code or as SQL scripts, and apply changes to your database automatically.

All these solutions keep track of which migrations have already been run against your database and which are new migrations that need to be run, as well as actually executing the migrations against your database. What these tools don't control is when they run the migrations.

A trivial migration strategy

The question of when to run database migrations might seem to have an obvious answer: before the new application that runs them starts. But there's some nuance to that answer, which becomes especially hard in a web-farm scenario, where you have multiple instances of your application.

One of the simplest options would be:

  • Divert traffic to a "holding" website
  • Stop your application
  • Run the database migrations
  • Start the new version of your application
  • Divert traffic to the new version

Clearly this isn't an acceptable approach in the current always-on world most businesses work in, but for your simple, low-traffic, side-project, it'll probably do the job. This just skirts around the problem rather than solving it though, so I won't be discussing this solution further.

The discussions and options I'm describing here generally apply in any web-farm scenario, but I'm going to use Kubernetes terminology and examples seeing as this is a series about Kubernetes!

If you're not going to use this approach, and instead want to do zero-downtime migrations, then you have to accept the fact that during those migration periods, code is always going to run against multiple versions of the database.

Making database migrations safe

Let's use a concrete example. Imagine you are running a blogging platform, and you want to add a new feature to your BlogPost entity: Category. Each blog post can be assigned to a single top-level category, so you add a categories table containing the list of categories, and a category_id column to your blog_posts table, referencing the categories table.

Now lets think about how we deploy this. We have two "states" for the code:

  • Before the code for working with Category was added
  • After the code for working with Category was added.

There's also two possible states for the database:

  • The database without the categories table and category_id column
  • The database with the categories table and category_id column

In terms of the migration, you have two options:

  1. Deploy the new code first, and then run the database migrations. In which case, the before code only has to work with the database without the categories table, but the after code has to work with both database schemas.

  2. Run the database migrations first, before you deploy the new code. This means the before code must work with both database schemas, but the after code can assume that the tables have already been added.

Image showing the two types of database schema migration

You can use either approach for your migrations, but I prefer the latter. Database migrations are typically the most risky part of deployment, so I like to do them first—if there's a problem, the deployment will fail, and the new code will never be deployed.

In practical terms, the fact that your new database schema needs to be compatible with the previous version of the software generally means you can't introduce NOT NULL columns to existing tables, as code that doesn't know about the columns will fail to insert. Your main options are either make the column nullable (and potentially make it required in a subsequent deploy) or configure a default in the database, so that the column is never null.

Generally, as long as you keep this rule in mind, database migrations shouldn't cause you too much trouble. When writing your migration just think: "if I only run the database migration, will the existing code keep break?" If the answer is "no", then you should be fine.

Choosing when to run migrations

We've established that we want to run database migrations before our new code starts running, but that still gives a fair bit of leeway. I see three main approaches

  • Running migrations on application startup
  • Running migrations as part of the deployment process script
  • Running migrations using Kubernetes Jobs and init containers

Each of these approaches has benefits and trade-offs, so I'll discuss each of them in turn.

So we have something concrete to work with, lets imagine that your blogging application is deployed to Kubernetes. You have an ingress, a service, and a deployment, as I've discussed previously in this series. The deployment ensures you keep 3 replicas of your application running at any one time to handle web traffic

Sample application consisting of an ingress, a service, and 3 pods
The sample application consisting of an ingress, a service, and 3 pods

You need to run database migrations when you deploy a new version of your app. Lets walk through the various options available.

Running migrations on application startup

The first, and most obvious, option is to run your database migrations when your application starts up. You can do this with EF Core by calling DbContext.Database.Migrate():

public static void Main(string[] args)
{
    var host = CreateHostBuilder(args).Build();

    using (var scope = host.Services.CreateScope())
    {
        var db = scope.ServiceProvider.GetRequiredService<ApplicationDbContext>();
        db.Database.Migrate(); // apply the migrations
    }

    host.Run(); // start handling requests
}

Despite being the most obvious option, this has some important problems:

  • Every instance of the application will attempt to migrate the database
  • The application has permissions to perform destructive updates to the database

The first point is the most obvious issue: if we have 3 replicas, and we try and perform a rolling update then we may end up with multiple applications trying to migrate the database at the same time. This is unsupported in every migration tool I know of, and carries the risk of data corruption.

There are ways you could try and ensure only one new instance of the app runs the migrations, but I'm not convinced by any of them, and I'd rather not take the chance of screwing up my database!

The second point is security related. Migrations are, by necessity, dangerous, as they have the potential for data loss and corruption. A good practice is to use a different database account for running migrations than you use in the normal running of your application. That reduces the risk of accidental (or malicious) data loss when your app is executing—if the application doesn't have permission to DROP tables, then there's no risk of that accidentally happening.

If your app is responsible for both running migrations and running your code, then by necessity, it must have access to privileged credentials. You can ensure that only the migrations use the privileged account, but a more foolproof approach is to not allow access to those credentials at all.

Running migrations as part of the deployment process script

Another common approach is to run migrations as part of the deployment process, such as an Octopus Deploy deployment plan. This solves both of the issues I described in the previous section—you can ensure that Octopus won't run migrations concurrently, and once the database migrations are complete, it will deploy your application code. Similarly, as the migration are separate from your code, it's easier to use a different set of credentials.

Diagram of Octopus deploying your code
Image taken from Octopus blog

This leaves the question of how to run the migrations, and what does it actually mean for Octopus to run the migrations? In the example above, Octopus acquires migration scripts and applies them to the database directly. On the plus side, this makes it easy to get started, and removes the need to handle running migrations directly in your application code. However, it couples you very strongly to Octopus. That may or may not be a trade-off you're happy with.

Instead, my go-to approach is to use a simple .NET Core CLI application as a "database runner". In fact, I typically make this a "general purpose" command runner, for example using Jeremy D Miller's Oakton project, so I can use it for running one-off ad-hoc commands too.

This post is long enough, so I'm not going to show how to write a CLI tool like that here. That said, it's a straight forward .NET Core command line project, so there shouldn't be any gotchas.

If you use this approach then the question remains: where do you run the CLI tool? Your CLI project has to actually run on a machine somewhere, so you'll need to take that into account. Serverless is probably no good either, as your migrations will likely be too long-running.

Octopus can certainly handle all this for you, and if you're already using it, this is probably the most obvious solution.

There is an entirely Kubernetes-based solution though, which is the approach I've settled on.

Using Kubernetes Jobs and init containers

My preferred solution uses two Kubernetes-native constructs: Jobs and init containers.

Jobs

A Kubernetes job executes one or more pods to completion, optionally retrying if the pod indicates it failed, and then completes when the pod exits gracefully.

This is exactly what we want for database migrations—we can create a job that executes the database migration CLI tool, optionally retrying to handle transient network issues. As it's a "native" Kubernetes concept, we can also template it with Helm charts, including it in our application's helm chart. In the image below I've extended the test-app helm chart from a previous post by adding a CLI tool project with a job.yaml chart (I'll show the chart in detail in the next post in the series).

Helm chart layout including CLI migration project

The difficulty is ensuring that the Job executes and completes before your other applications start. The approach I've settled on uses init Containers, another Kubernetes concept.

Init Containers

If you remember back to the first post in this series, I said that a Pod is the smallest unit of deployment in Kubernetes, and can contain one or more containers. In most cases a Pod will contain a single "main" container that provides the pod's functionality, and optionally one or more "sidecar" containers that provide additional capability to the main container, such as metrics or service-mesh capability.

You can also include init containers in a pod. When Kubernetes deploys a pod, it executes all the init containers first. Only once all of those containers have exited gracefully (i.e. not crashed) will the main container be executed. They're often used for downloading or configuring pre-requisites required by the main container. That keeps your container application focused on it's one job, instead of having to configure its environment too.

Combining jobs and init containers to handle migrations

Initially, when first exploring init containers, I tried using init containers as the mechanism for running database migrations directly, but this suffers from the same concurrency issues as running on app-startup: when you have multiple pods, every pod tries to run migrations at the same time. Instead, we switched to a two step approach: we use init containers to delay our main application from starting until a Kubernetes Job has finished executing the migrations.

The process (also shown in the image below) looks something like this:

  • The Helm chart for the application consists of one or more "application" deployments, and a "migration" Job.
  • Each application pod contains an init container that sleeps until the associated Job is complete. When the init container detects the Job is complete, it exits, and the main application containers start.
  • As part of a rolling update, the migration job is deployed, and immediately starts executing. Instances of the new application are created, but as the migration Job is running, the init containers are sleeping, and the new application containers are not run. The old-version instances of the application are unaffected, and continue to handle traffic.
  • The migration job migrates the database to the latest version, and exits.
  • The init containers see that the job has succeeded, and exit. This allows the application containers to startup, and start handling traffic.
  • The remaining old-version pods are removed using a rolling update strategy.
Image showing the deployment process using Jobs and init containers

As I say, this approach is one that I've been using successfully for several years now, so I think it does the job. In the next post I'll go into the details of actually implementing this approach.

Before we finish, I'll discuss one final approach: using Helm Chart Hooks.

Helm Chart Hooks

On paper, Helm Chart Hooks appear to do exactly what we're looking for: they allow you to run a Job as part of installing/upgrading a chart, before the main deployment happens.

In my first attempts at handling database migrations, this was exactly the approach I took. You can convert a standard Kubernetes Job into a Helm Hook by adding an annotation, to the job's YAML for example:

apiVersion: batch/v1
kind: Job
metadata:
  name: "{{ .Release.Name }}"
  annotations:
    # This is what defines this resource as a hook
    "helm.sh/hook": pre-install
...

Simply adding that line ensures that Helm doesn't deploy the resource as part of the normal chart install/upgrade process. Instead, it deploys the job before the main chart, and waits for the job to finish. Once the job completes successfully, the chart is installed, performing a rolling update of your application. If the job fails, the chart install fails, and your existing deployment is unaffected.

My initial testing of this approach generally worked well, with one exception. If a database migration took a long time, Helm would timeout waiting for the job to complete, and would fail the install. In reality, the job may or may not succeed in the cluster.

This was a deal breaker for us. Random timeouts, and the reality that production environments (with the larger quantity of data and higher database loads) were likely to be slower for migrations made us look elsewhere. Ultimately we settled on the init container approach I described in the previous section.

I haven't looked at Helm Chart Hooks again in a while, so it's possible that this is no longer an issue, but I don't see anything addressing it in the documentation.

Summary

In this post I described the general approaches to running database migrations when deploying to Kubernetes. I discussed the need to write your database migrations to be compatible with multiple versions of your application code and described several approaches you could take.

My preferred approach is to build a CLI tool that is responsible for executing the application's database migrations, and to deploy this as a Kubernetes job. In addition, I include an init container inside each application's pod, which delays the start of the application container until after the job completes successfully.

In this post I just discussed the concepts—in the next post in this series I describe the implementation. I will show how to implement a Kubernetes Job as a Helm Chart and how to use init containers to control your application container startup process

Running database migrations using jobs and init containers: Deploying ASP.NET Core applications to Kubernetes - Part 8

$
0
0
Running database migrations using jobs and init containers

In the previous post I described several ways to run database migrations when deploying to Kubernetes. In this post, I show to implement my preferred approach using Kubernetes Jobs and init containers. I'll show an example Helm Chart for a job, and how to update your existing application pods to use init containers that wait for the job to complete.

A quick recap: the database migration solution with Jobs and init containers

In my previous post I discussed the need to run database migrations as part of an application deployment, so that the database migrations are applied before the new application code starts running. This allows zero-downtime deployments, and ensures that the new application code doesn't have to work against old versions of the database.

As I mentioned in the previous post, this does still require you to be thoughtful with your database migrations so as to not break your application in the period after running migrations but before your application code is fully updated.

The approach I described consists of three parts:

  • A .NET Core command line project, as part of the overall application solution, that executes the migrations against the database.
  • A Kubernetes job that runs the migration project when the application chart is installed or upgraded.
  • Init containers in each application pod that block the execution of new deployments until after the job has completed successfully.

With these three components, the overall deployment process looks like the following:

Image showing the deployment process using Jobs and init containers

For the remainder of the post I'll describe how to update your application's Helm Charts to implement this in practice.

The sample application

For this post I'll extend a sample application I described in a previous post. I described creating a helm chart containing two sub-applications, an "API app", with a public HTTP API and associated ingress, and a "service app" which did not have an ingress, and would be responsible, for example, for handling messages from a message bus.

Image of the various resources created by the Helm chart
The existing application. Helm creates a deployment of each app, with an associated service. We also specified that an ingress should be created for the test-app-api app

Currently the test-app chart consists of two sub-charts:

  • test-app-api: the API app, with a template for the application deployment (managing the pods containing the application itself), a service (an internal load-balancer for the pods), and an ingress (exposing the HTTP endpoint to external clients)
  • test-app-service: the "message bus handler" app, with a template for the application deployment (managing the pods containing the application itself) and a service for internal communication (if required).

These sub charts are nested under the top-level test-app, giving a folder structure something like the following:

File structure for nested solutions

In this post we assume we now need to run database migrations when this chart is installed or updated.

The .NET Core database migration tool

The first component is the separate .NET project that executes database migrations. There are lots of tools you can use to implement the migrations. For example:

For our projects we typically have a "utility" command line tool that we use for running ad-hoc commands. We use Oakton for parsing command line arguments and typically have multiple commands you can issue. "Migrate database" is one of these commands.

Just so we have something to test, I created a new console application using dotnet new console and updated the Program.cs to sleep for 30s before returning successfully:

using System;
using System.Threading;

namespace TestApp.Cli
{
    class Program
    {
        static void Main(string[] args)
        {
            Console.WriteLine("Running migrations...");
            Thread.Sleep(30_000);
            Console.WriteLine("Migrations complete!");
        }
    }
}

This will serve as our "migration" tool. We'll build it into a Docker container, and use it to create a Kubernetes Job that is deployed with the application charts.

Creating a Kubernetes Job

The Helm Chart template for a Kubernetes Job is similar in many ways to the Helm Chart template for an application deployment, as it re-uses the "pod manifest" that defines the actual containers that make up the pod.

The example below is the full YAML for the Kubernetes Job, including support for injecting environment variables as described in a previous post. I'll discuss the YAML in more detail below

apiVersion: batch/v1
kind: Job
metadata:
  name: {{ include "test-app-cli.fullname" . }}-{{ .Release.Revision }}
  labels:
    {{- include "test-app-cli.labels" . | nindent 4 }}
spec:
  backoffLimit: 1
  template:
    metadata:
      labels:
        {{- include "test-app-cli.selectorLabels" . | nindent 8 }}
    spec:
      containers:
      - name: {{ .Chart.Name }}
        image: "{{ .Values.image.repository }}:{{ .Values.image.tag | default .Chart.AppVersion }}"
        imagePullPolicy: {{ .Values.image.pullPolicy }}
        command: ["dotnet"]
        args: ["TestApp.Cli.dll", "migrate-database"]
        env:
          {{- $env := merge .Values.env .Values.global.env -}}
          {{ range $k, $v := $env }}
            - name: {{ $k | quote }}
              value: {{ $v | quote }}
          {{- end }}
      restartPolicy: {{ .Values.job.restartPolicy }}

apiVersion, version, metadata

This section is standard for all Kubernetes manifests. It specifies that we're using version 1 of the Job manifest, and we use some of Helm's helper functions to create appropriate labels and names for the created resource.

One point of interest here - we create a unique name for the job by appending the revision number. This ensures that a new migration job is created on every install/upgrade of the chart.

backoffLimit

This property is specific to the Job manifest, and indicates the number of times a job should be retried if it fails. In this example, I've set .spec.backoffLimit=1, which means we'll retry once if the migrations fail. If the migrations fail on the second attempt, the Job will fail completely. In that case, as the job will never complete, the new version of the application code will never run.

template

This is the main pod manifest for the job. It defines which containers will run as part of the job and their configuration. This section is very similar to what you will see in a typical deployment manifest, as both manifests are about defining the containers that run in a pod.

The main difference in this example, is that I've overridden the command and args properties. This combination of command and args is equivalent to running dotnet TestApp.Cli.dll migrate-database when the container starts.

That's all there is to the job manifest. Create the manifest as the only template in the test-app-cli sub-chart of the top-level test-app:

Helm chart layout including CLI migration project

One final thing is to add some configuration to the top-level values.yaml file, to configure the migration app:

test-app-cli:

  image:
    repository: andrewlock/my-test-cli
    pullPolicy: IfNotPresent
    tag: ""

  job:
    ## Should the job be rescheduled on the same node if it fails, or just stopped
    restartPolicy: Never

I've added some default values for the container. You could add extra default configuration if required, for example standard environment variables, as I showed in a previous post.

Testing the job

At this point, we could test installing our application, to make sure the job executes correctly.

Assuming you have helm installed and configured to point to a cluster, and that you have built and tagged your containers as version 0.1.1, you can install the top-level chart by running:

helm upgrade --install my-test-app-release . \
  --namespace=local \
  --set test-app-cli.image.tag="0.1.1" \
  --set test-app-api.image.tag="0.1.1" \
  --set test-app-service.image.tag="0.1.1" \
  --debug

If you check the Kubernetes dashboard after running this command, you'll see a new Job has been created, called my-test-app-release-test-app-cli:

A new job is created when you install the chart

The 1/1 in the Pods column indicates that the Job is executing an instance of your CLI pod. If you check in the Pods section, you'll see that the app, CLI, and service pods are running. In the example below, the API pod is still in the process of starting up:

Note that we haven't implemented the init containers yet, so our application pods will immediately start handling requests without waiting for the job to finish. We'll address this shortly.

The job executes the pod

After 30 seconds, our Thread.Sleep() completes, and the "migration" pod exits. At this point the Job is complete. If you view the Job in the Kubernetes dashboard you'll see that the Pod shows a status of Terminated: Completed with a green tick, and that we have reached the required numbers of "completions" for the Job (for details on more advanced job requirements, see the documentation).

The job has completed

We're now running migrations as part of our deployment, but we need to make sure the migrations complete before the new application containers start running. To achieve that, we'll use init containers.

Using init containers to delay container startup

A Kubernetes pod is the smallest unit of deployment in Kubernetes. A pod can contain multiple containers, but it typically only has a single "main" container. All of the containers in a pod will be scheduled to run together, and they'll all be removed together if the main container dies.

Init containers are a special type of container in a pod. When Kubernetes deploys a pod, it runs all the init containers first. Only once all of those containers have exited gracefully will the main containers be executed. Init containers are often used for downloading or configuring pre-requisites required by the main container. That keeps your container application focused on it's one job, instead of having to configure it's environment too.

In this case, we're going to use init containers to watch the status of the migration job. The init container will sleep while the migration job is running (or if it crashes), blocking the start of our main application container. Only when the job completes successfully will the init containers exit, allowing the main container to start.

groundnuty/k8s-wait-for

In this section I'll show how to implement an init container that waits for a specific job to complete. The good news is there's very little to write, thanks to a little open-source project k8s-wait-for. The sole purpose of this project is exactly what we describe: to wait for pods or jobs to complete and then exit.

We can use a Docker container containing the k8s-wait-for script, and include it as an init container in all our application deployments. With a small amount of configuration, we get the behaviour we need.

For example, the manifest snippet below is for the test-app-api's deployment.yaml. I haven't shown the whole file for brevity—the important point is the initContainers section:

apiVersion: apps/v1
kind: Deployment
metadata:
  name: {{ include "test-app-api.fullname" . }}
spec:
  template:
    # ... metadata and labels elided
    spec:
      # The init containers
      initContainers:
      - name: "{{ .Chart.Name }}-init"
        image: "groundnuty/k8s-wait-for:1.3"
        imagePullPolicy: {{ .Values.image.pullPolicy }}
        args: 
        - "job"
        - "{{ .Release.Name }}-test-app-cli-{{ .Release.Revision}}"
      containers:
      # application container definitions
      - name: {{ .Chart.Name }}
          image: "{{ .Values.image.repository }}:{{ .Values.image.tag | default .Chart.AppVersion }}"
        # ...other container configuration

The initContainers section is the interesting part. We provide a name for the container (I've used the name of the sub-chart with an -init suffix, e.g. test-app-api-init), and specify that we should run the Docker image groundnuty/k8s-wait-for:1.3, using the specified imagePullPolicy from configuration.

We specify what the init container should wait for in the args dictionary. In this case we choose to wait for a job with the name "{{ .Release.Name }}-test-app-cli-{{ .Release.Revision}}". Once Helm expands that template, it will look something like my-test-app-release-test-app-cli-6, with the final Revision number incrementing with each chart update. That matches the name: we gave to the job that is deployed in this release.

And that's it. Add the initContainers section to all your "main" application deployments (two in this case: the API app and the message handler service). Next time you install a chart, you'll see the behaviour we've been chasing. The new application deployments are created at the same time as the job, but they don't actually start. Instead, they sit in the PodInitializing status:

The init containers prevent the application starting while the job is running

As you can see in the previous image, while the job is running and the new application pods are blocked, the existing application pods continue to run and handle the traffic.

In practice, it's often unnecessary to have zero-downtime deployments for message-handling services, and it increases the chance of data inconsistencies. Instead, we typically use a "Recreate" strategy instead of Rolling Update for our message-handling apps (but use a rolling update for our APIs to avoid downtime).

Once the job completes, the init containers will exit, and the new application pods can start up. Once their startup, readiness, and liveness probes indicate they are healthy, Kubernetes will start sending them traffic, and will scale down the old application deployments.

The deployment is complete

Congratulations! You've just done a zero-downtime database migration and deployment with Kubernetes 🙂

Summary

In this post I showed how you can use Kubernetes jobs and init containers to run database migrations as part of a zero-downtime application upgrade. The Kubernetes job runs a single container that executes the database migrations as part of the Helm Chart installation. Meanwhile, init containers in the main application pods prevent the application containers from starting. Once the job completes, the init containers exit, and the new application containers can start.

Monitoring Helm releases that use jobs and init containers: Deploying ASP.NET Core applications to Kubernetes - Part 9

$
0
0
Monitoring Helm releases that use jobs and init containers

In the previous post in this series, I showed how I prefer to run database migrations when deploying ASP.NET Core applications to Kubernetes. One of the downsides of the approach I described, in which the migrations are run using a Job, is that it makes it difficult to know exactly when a deployment has succeeded or failed.

In this post I describe the problem and the approach I take to monitor the status of a release.

A quick recap: the database migration solution with Jobs and init containers

I've discussed our overall database migration approach in my last two posts, first in general, and then in more detail.

The overall approach can be summarised as:

  • Execute the database migration using a Kubernetes job that is part of the application's Helm chart, and is installed with the rest of the application deployments.
  • Add an init container to each "main" application pod, which monitors the status of the job, and only completes once the job has completed successfully.

The following chart shows the overall deployment process—for more details, see my previous post.

Image showing the deployment process using Jobs and init containers

The only problem with this approach is working out when the deployment is "complete". What does that even mean in this case?

When is a Helm chart release complete?

With the solution outlined above and in my previous posts, you can install your Helm chart using a command something like:

helm upgrade --install my-test-app-release . \
  --namespace=local \
  --set test-app-cli.image.tag="1.0.0" \
  --set test-app-api.image.tag="1.0.0" \
  --set test-app-service.image.tag="1.0.0" \
  --debug

The question is, how do you know if the release has succeeded? Did your database migrations complete successfully? Have your init containers unblocked your application pods, and allowed the new pods to start handling traffic?

Until all those steps have taken place, your release hasn't really finished yet. If the migrations fail, the init containers will never unblock, and your new application pods will never be started. You won't get downtime if you're using Kubernetes' rolling-update strategy (the default), but your new application won't be deployed either!

Initially, it looks like Helm should have you covered. The helm status command lets you view the status of a release. That's what we want right? Unfortunately not. This is the output I get from running helm status my-test-app-release shortly after doing an update.

> helm status my-test-app-release
LAST DEPLOYED: Fri Oct  9 11:06:44 2020
NAMESPACE: local
STATUS: DEPLOYED

RESOURCES:
==> v1/Service
NAME                                  TYPE       CLUSTER-IP     EXTERNAL-IP  PORT(S)  AGE
my-test-app-release-test-app-api      ClusterIP  10.102.15.166  <none>       80/TCP   47d
my-test-app-release-test-app-service  ClusterIP  10.104.28.71   <none>       80/TCP   47d

==> v1/Deployment
NAME                                  DESIRED  CURRENT  UP-TO-DATE  AVAILABLE  AGE
my-test-app-release-test-app-api      1        2        1           0          47d
my-test-app-release-test-app-service  1        2        1           0          47d

==> v1/Job
NAME                                DESIRED  SUCCESSFUL  AGE
my-test-app-release-test-app-cli-9  1        0           15s

==> v1beta1/Ingress
NAME                              HOSTS                ADDRESS  PORTS  AGE
my-test-app-release-test-app-api  chart-example.local  80       47d

==> v1/Pod(related)
NAME                                                   READY  STATUS    RESTARTS  AGE
my-test-app-release-test-app-api-7ddd69c8cd-2dwv5      1/1    Running   0         23m
my-test-app-release-test-app-service-5859745bbc-9f26j  1/1    Running   0         23m
my-test-app-release-test-app-api-68cc5d7ff-wkpmb       0/1    Init:0/1  0         15s
my-test-app-release-test-app-service-6fc875454b-b7ml9  0/1    Init:0/1  0         15s
my-test-app-release-test-app-cli-9-7gvqq              1/1    Running   0         15s

There's quite a lot we can glean from this view:

  • Helm tells us says the latest release was deployed on 9th October into the local namespace, and has a status of DEPLOYED.
  • The Service, Deployment, and Ingress resources were all created 47 days ago. That's when I first installed them in the cluster.
  • The latest Job, my-test-app-release-test-app-cli-9 has 0 pods in the Successful status. That's not surprising, as we can see the associated Pod, my-test-app-release-test-app-cli-9-7gvqq is still running the migrations
  • One API pod and one service pod are running. These are actually the pods from the previous deployment, which are ensuring our zero downtime release.
  • The other API and service pods are sat in the Init:0/1 status. That means they are waiting for their init container to exit (each pod has 1 init container, and 0 init containers have completed).

The problem is that as far as Helm is concerned, the release has completed successfully. Helm doesn't know about our "delayed startup" approach. All Helm knows is it had resources to install, and they were installed. Helm is done.

To be fair, Helm does have approaches that I think would improve this, namely Chart Hooks and Chart Tests. Plus, theoretically, helm install --wait should work here I think. Unfortunately I've always run into issues with all of these. It's quite possible I'm not using them correctly, so if you have a solution that works, let me know in the comments!

So where does that leave us? Unfortunately, the only approach I've found that works is a somewhat hacky bash script to poll the statuses…

Waiting for releases to finish by polling

So as you've seen, Helm sort of lies about the status of our release, as it says DEPLOYED before our migration pod has succeeded and our application pods are handling requests. However, helm status does give us a hint of how to determine when a release is out: watch the status of the pods.

The following script is based on this hefty post from a few years ago which attempts to achieve exactly what we're talking about—waiting for a Helm release to be complete.

I'll introduce the script below in pieces, and discuss what's it doing first. If you just want to see the final script you can jump to the end of the post.

As this series is focused on Linux containers in Kubernetes, the script below uses Bash. I don't have a PowerShell version of it, but hopefully you can piece one together from my descriptions if that's what you need!

Prerequisites

This script assumes that you have the following:

  • The Kubernetes kubectl tool installed, configured to point to your Kubernetes cluster.
  • The Helm command line tool installed.
  • A chart to install. Typically this would be pushed to a chart repository, but as for the rest of this series, I'm assuming it's unpacked locally.
  • Docker images for the apps in your helm chart, tagged with a version DOCKER_TAG, and pushed to a Docker repository accessible by your Kubernetes cluster.

As long as you have all those, you can use the following script.

Installing the Helm chart

The first part of the script sets some variables based on environment variables passed when invoking the script. It then installs the chart CHART into the namespace NAMESPACE, giving it the name RELEASE_NAME, and applying the provided additional arguments HELM_ARGS. You would call the script something like the following:

CHART="my-chart-repo/test-app"
RELEASE_NAME="my-test-app-release" \
NAMESPACE="local" \
HELM_ARGS="--set test-app-cli.image.tag=1.0.0 \
  --set test-app-api.image.tag=1.0.0 \
  --set test-app-service.image.tag=1.0.0 \
" \
./deploy_and_wait.sh

This sets environment variables for the process and calls the ./deploy_and_wait.sh script.

The first part of the script checks that the required variables have been provided, fetches the details of your Kubernetes cluster, and then performs the Helm chart install:

#!/bin/bash
set -euo pipefail

# Required Variables: 
[ -z "$CHART" ] && echo "Need to set CHART" && exit 1;
[ -z "$RELEASE_NAME" ] && echo "Need to set RELEASE_NAME" && exit 1;
[ -z "$NAMESPACE" ] && echo "Need to set NAMESPACE" && exit 1;

# Set the helm context to the same as the kubectl context
KUBE_CONTEXT=$(kubectl config current-context)

# Install/upgrade the chart
helm upgrade --install \
  $RELEASE_NAME \
  $CHART \
  --kube-context "${KUBE_CONTEXT}" \
  --namespace="$NAMESPACE" \
  $HELM_ARGS

Now we've installed the chart, we need to watch for the release to complete (or fail)

Waiting for the release to be deployed

The first thing we need to do is wait for the release to be complete as far as Helm is concerned. If you remember back to earlier, Helm marked our release as DEPLOYED very quickly, but depending on your Helm chart (if you're using Helm hooks for something for example) and your cluster, that may take a little longer.

The next part of the script watches Helm by polling helm for a list of releases using helm ls -q and searches for our RELEASE_NAME using grep. We're just waiting for the release to appear in the list here, so that should happen very quickly. If it doesn't appear, something definitely went wrong, so we abandon the script with a non-zero exit

echo 'LOG: Watching for successful release...'

# Timeout after 6 repeats = 60 seconds
release_timeout=6
counter=0

# Loop while $counter < $release_timeout
while [ $counter -lt $release_timeout ]; do
    # Fetch a list of release names
    releases="$(helm ls -q --kube-context "${KUBE_CONTEXT}")"

    # Check if $releases contains RELEASE_NAME
    if ! echo "${releases}" | grep -qF "${RELEASE_NAME}"; then

        echo "${releases}"
        echo "LOG: ${RELEASE_NAME} not found. ${counter}/${release_timeout} checks completed; retrying."

        # NOTE: The pre-increment usage. This makes the arithmatic expression
        # always exit 0. The post-increment form exits non-zero when counter
        # is zero. More information here: http://wiki.bash-hackers.org/syntax/arith_expr#arithmetic_expressions_and_return_codes
        ((++counter))
        sleep 10
    else
        # Our release is there, we can stop checking
        break
    fi
done

if [ $counter -eq $release_timeout ]; then
    echo "LOG: ${RELEASE_NAME} failed to appear." 1>&2
    exit 1
fi

Now we know that we have a release, we can check the status of the pods. There's two statuses we're looking for Running and Succeeded:

  • Succeeded means the pod exited successfully, which is what we want for the pods that make up our migration job.
  • Running means the pod is currently running. This is the final status we want for our application pods, once the release is complete.

Our migration job pod will be Running initially, before the release is complete, but we know that our application pods won't start running until the job succeeds. Therefore we need to wait for all the release pods to be in either the Running or Succeeded state. Additionally, if we see Failed, we know the release failed.

In this part of the script we use kubectl get pods to fetch all the pods which have a label called app.kubernetes.io/instance set to the RELEASE_NAME. This label is added to your pods by Helm by default if you use the templates created by helm init as I described in a previous post.

The output of this command is assigned to release_pods, and will look something like:

my-test-app-release-test-app-api-68cc5d7ff-wkpmb        Running
my-test-app-release-test-app-api-9dc77f7bc-7n596        Pending
my-test-app-release-test-app-cli-11-6rlsl               Running
my-test-app-release-test-app-service-6fc875454b-b7ml9   Running
my-test-app-release-test-app-service-745b85d746-mgqps   Pending

Note that this also includes running pods from the previous release. Ideally we'd filter those out, but I've never bothered working that out, as they don't cause any issues!

Once we have all the release pods, we check to see if any are Failed. If they are, we're done, and the release has failed.

Otherwise, we check to see if any of the pods are not Running or Succeeded. If, as in the previous example, some of the pods are still Pending (because the init containers are blocking) then we sleep for 10s. After that we check again.

If all the pods are in the Running or Succeeded state - we're done, the release was a success! If that never happens, eventually we time out, and exit in a failed state.

# Timeout after 20 mins (to leave time for migrations)
timeout=120
counter=0

# While $counter < $timeout
while [ $counter -lt $timeout ]; do

    # Fetch all pods tagged with the release
    release_pods="$(kubectl get pods \
        -l "app.kubernetes.io/instance=${RELEASE_NAME}" \
        -o 'custom-columns=NAME:.metadata.name,STATUS:.status.phase' \
        -n "${NAMESPACE}" \
        --context "${KUBE_CONTEXT}" \
        --no-headers \
    )"

    # If we have any failures, then the release failed
    if echo "${release_pods}" | grep -qE 'Failed'; then
      echo "LOG: ${RELEASE_NAME} failed. Check the pod logs."
      exit 1
    fi

    # Are any of the pods _not_ in the Running/Succeeded status?
    if echo "${release_pods}" | grep -qvE 'Running|Succeeded'; then

        echo "${release_pods}" | grep -vE 'Running|Succeeded'
        echo "${RELEASE_NAME} pods not ready. ${counter}/${timeout} checks completed; retrying."

        # NOTE: The pre-increment usage. This makes the arithmatic expression
        # always exit 0. The post-increment form exits non-zero when counter
        # is zero. More information here: http://wiki.bash-hackers.org/syntax/arith_expr#arithmetic_expressions_and_return_codes
        ((++counter))
        sleep 10
    else
        #All succeeded, we're done!
        echo "${release_pods}"
        echo "LOG: All ${RELEASE_NAME} pods running. Done!"
        exit 0
    fi
done

# We timed out
echo "LOG: Release ${RELEASE_NAME} did not complete in time" 1>&2
exit 1

Obviously this isn't very elegant. We're polling repeatedly, trying to infer whether everything completed successfully. Eventually (20 mins in this case), we throw up our hands and say "it's clearly not going to happen!". I wish I had a better answer for you, but right now, it's the best I've got 🙂

Putting it all together

Lets put it all together now. Copy the following into a file called deploy_and_wait.sh and give execute permissions to the file using chmod +x ./deploy_and_wait.sh.

#!/bin/bash
set -euo pipefail

# Required Variables: 
[ -z "$CHART" ] && echo "Need to set CHART" && exit 1;
[ -z "$RELEASE_NAME" ] && echo "Need to set RELEASE_NAME" && exit 1;
[ -z "$NAMESPACE" ] && echo "Need to set NAMESPACE" && exit 1;

# Set the helm context to the same as the kubectl context
KUBE_CONTEXT=$(kubectl config current-context)

# Install/upgrade the chart
helm upgrade --install \
  $RELEASE_NAME \
  $CHART \
  --kube-context "${KUBE_CONTEXT}" \
  --namespace="$NAMESPACE" \
  $HELM_ARGS

echo 'LOG: Watching for successful release...'

# Timeout after 6 repeats = 60 seconds
release_timeout=6
counter=0

# Loop while $counter < $release_timeout
while [ $counter -lt $release_timeout ]; do
    # Fetch a list of release names
    releases="$(helm ls -q --kube-context "${KUBE_CONTEXT}")"

    # Check if $releases contains RELEASE_NAME
    if ! echo "${releases}" | grep -qF "${RELEASE_NAME}"; then

        echo "${releases}"
        echo "LOG: ${RELEASE_NAME} not found. ${counter}/${release_timeout} checks completed; retrying."

        # NOTE: The pre-increment usage. This makes the arithmatic expression
        # always exit 0. The post-increment form exits non-zero when counter
        # is zero. More information here: http://wiki.bash-hackers.org/syntax/arith_expr#arithmetic_expressions_and_return_codes
        ((++counter))
        sleep 10
    else
        # Our release is there, we can stop checking
        break
    fi
done

if [ $counter -eq $release_timeout ]; then
    echo "LOG: ${RELEASE_NAME} failed to appear." 1>&2
    exit 1
fi


# Timeout after 20 mins (to leave time for migrations)
timeout=120
counter=0

# While $counter < $timeout
while [ $counter -lt $timeout ]; do

    # Fetch all pods tagged with the release
    release_pods="$(kubectl get pods \
        -l "app.kubernetes.io/instance=${RELEASE_NAME}" \
        -o 'custom-columns=NAME:.metadata.name,STATUS:.status.phase' \
        -n "${NAMESPACE}" \
        --context "${KUBE_CONTEXT}" \
        --no-headers \
    )"

    # If we have any failures, then the release failed
    if echo "${release_pods}" | grep -qE 'Failed'; then
      echo "LOG: ${RELEASE_NAME} failed. Check the pod logs."
      exit 1
    fi

    # Are any of the pods _not_ in the Running/Succeeded status?
    if echo "${release_pods}" | grep -qvE 'Running|Succeeded'; then

        echo "${release_pods}" | grep -vE 'Running|Succeeded'
        echo "${RELEASE_NAME} pods not ready. ${counter}/${timeout} checks completed; retrying."

        # NOTE: The pre-increment usage. This makes the arithmatic expression
        # always exit 0. The post-increment form exits non-zero when counter
        # is zero. More information here: http://wiki.bash-hackers.org/syntax/arith_expr#arithmetic_expressions_and_return_codes
        ((++counter))
        sleep 10
    else
        #All succeeded, we're done!
        echo "${release_pods}"
        echo "LOG: All ${RELEASE_NAME} pods running. Done!"
        exit 0
    fi
done

# We timed out
echo "LOG: Release ${RELEASE_NAME} did not complete in time" 1>&2
exit 1

Now, build your app, push the Docker images to your docker repository, ensure the chart is accessible, and run the deploy_and_wait.sh script using something similar to the following:

CHART="my-chart-repo/test-app" \
RELEASE_NAME="my-test-app-release" \
NAMESPACE="local" \
HELM_ARGS="--set test-app-cli.image.tag=1.0.0 \
  --set test-app-api.image.tag=1.0.0 \
  --set test-app-service.image.tag=1.0.0 \
" \
./deploy_and_wait.sh

When you run this, you'll see something like the following. You can see Helm install the chart, and then the rest our script kicks in, waiting for the CLI migrations to finish. When they do, and our application pods start, the release is complete, and the script exits.

Release "my-test-app-release" has been upgraded. Happy Helming!
LAST DEPLOYED: Sat Oct 10 11:53:37 2020
NAMESPACE: local
STATUS: DEPLOYED

RESOURCES:
==> v1/Service
NAME                                  TYPE       CLUSTER-IP     EXTERNAL-IP  PORT(S)  AGE
my-test-app-release-test-app-api      ClusterIP  10.102.15.166  <none>       80/TCP   48d
my-test-app-release-test-app-service  ClusterIP  10.104.28.71   <none>       80/TCP   48d

==> v1/Deployment
NAME                                  DESIRED  CURRENT  UP-TO-DATE  AVAILABLE  AGE
my-test-app-release-test-app-api      1        2        1           1          48d
my-test-app-release-test-app-service  1        2        1           1          48d

==> v1/Job
NAME                                 DESIRED  SUCCESSFUL  AGE
my-test-app-release-test-app-cli-12  1        0           2s

==> v1beta1/Ingress
NAME                              HOSTS                ADDRESS  PORTS  AGE
my-test-app-release-test-app-api  chart-example.local  80       48d

==> v1/Pod(related)
NAME                                                   READY  STATUS    RESTARTS  AGE
my-test-app-release-test-app-api-6f7696fd8b-74mg8      0/1    Init:0/1  0         2s
my-test-app-release-test-app-api-9dc77f7bc-7n596       1/1    Running   0         13m
my-test-app-release-test-app-service-745b85d746-mgqps  1/1    Running   0         13m
my-test-app-release-test-app-service-8ff5c994c-dqdzx   0/1    Init:0/1  0         2s
my-test-app-release-test-app-cli-12-5tvtm              1/1    Running   0         2s


LOG: Watching for successful release...
my-test-app-release-test-app-api-6f7696fd8b-74mg8       Pending
my-test-app-release-test-app-service-8ff5c994c-dqdzx    Pending
my-test-app-release pods not ready. 0/120 checks completed; retrying.
my-test-app-release-test-app-api-6f7696fd8b-74mg8       Pending
my-test-app-release-test-app-service-8ff5c994c-dqdzx    Pending
my-test-app-release pods not ready. 1/120 checks completed; retrying.
my-test-app-release-test-app-api-6f7696fd8b-74mg8       Pending
my-test-app-release-test-app-service-8ff5c994c-dqdzx    Pending
my-test-app-release pods not ready. 2/120 checks completed; retrying.
my-test-app-release-test-app-api-6f7696fd8b-74mg8       Pending
my-test-app-release-test-app-service-8ff5c994c-dqdzx    Pending
my-test-app-release pods not ready. 3/120 checks completed; retrying.
my-test-app-release-test-app-api-6f7696fd8b-74mg8       Running
my-test-app-release-test-app-api-9dc77f7bc-7n596        Running
my-test-app-release-test-app-cli-12-5tvtm               Succeeded
my-test-app-release-test-app-service-745b85d746-mgqps   Running
my-test-app-release-test-app-service-8ff5c994c-dqdzx    Running
LOG: All my-test-app-release pods running. Done!

You can use the exit code of the script to trigger other processes, depending on how you choose to monitor your deployments. We use Octopus Deploy to trigger our deployments, which runs this script. If the release is installed successfully, the Octopus deployment is successful, if not it fails. What more could you want! 🙂

Octopus has built-in support for both Kubernetes and Helm, but they didn't when we first started this approach. Even so, there's something nice about deployments being completely portable bash scripts, rather than being tied to a specific vendor.

I'm not suggesting this is the best approach to deploying (I'm very interested in a GitOps approach such as Argo CD), but it's worked for us for some time, so I thought I'd share. Tooling has been getting better and better around Kubernetes the last few years, so I'm sure there's already a better approach out there! If you are using a different approach, let me know in the comments.

Summary

In this post I showed how to monitor a deployment that runs database migrations using Kubernetes jobs and init containers. The approach I show in this post uses a bash script to poll the state of the pods in the release, waiting for them all to move to the Succeeded or Running status.

Creating an 'exec-host' deployment for running one-off commands: Deploying ASP.NET Core applications to Kubernetes - Part 10

$
0
0
Creating an 'exec-host' deployment for running one-off commands

In this post I describe a pattern that lets you run arbitrary commands for your application in your Kubernetes cluster, by having a pod available for you to exec into. You can use this pod to perform ad-hoc maintenance, administration, queries—all those tasks that you can't easily schedule, because you don't know when you'll need to run them, or because that just doesn't make sense.

I'll describe the issue and the sort of tasks I'm thinking about, and discuss while this becomes tricky when you run your applications in Kubernetes. I'll then show the approach I use to make this possible: a long-running deployment of a pod containing a CLI tool that allows running the commands.

Background: running ad-hoc queries and tasks

One of the tenants of DevOps and general declarative approaches to software deployment, is that you try to automate as much as possible. You don't want to have to run database migrations manually as part of a deploy, or to have to remember to perform a specific sequence of operations when deploying your code. That should all be automated: ideally a deployment should, at most, require clicking a "deploy now" button.

Octopus allows one click deploys from a UI

Unfortunately, while we can certainly strive for that, we can't always achieve it. Bugs happen and issues arise that sometimes require some degree of manual intervention. Maybe a cache gets out of sync somehow and needs to be cleared. Perhaps a bug prevented some data being indexed in your ElasticSearch cluster, and you need to "manually" index it. Or maybe you want to test some backend functionality, without worrying about the UI.

If you know these tasks are going to be necessary, then you should absolutely try and run them automatically when they're going to be needed. For example, if you update your application to index more data in ElasticSearch, then you should automatically do that re-indexing when your application deploys.

We run these tasks as part of the "migrations" job I described in previous posts. Migrations don't just have to be database migrations!

If you don't know that the tasks are going to be necessary, then having a simple method to run the tasks is very useful. One option is to have an "admin" screen in your application somewhere that lets you simply and easily run the tasks.

Image of Hangfire.io's recurring jobs screen, showing Execute Now button
Hangfire lets you trigger jobs manually (image taken from https://www.hangfire.io/)

There's pros and cons to this approach. On the plus side, it provides an easy mechanism for running the tasks, and uses the same authentication and authorization mechanisms built into your application. The downside is that you're exposing various potentially destructive operations via an endpoint, which may require more privileges than the rest of your application. There's also the maintenance overhead of exposing and wiring up those tasks in the UI.

An alternative approach is the classic "system administrator" approach: a command line tool that can run the administrative tasks. The problem with this in the Kubernetes setting is where do you run the task? The tool likely needs access to the same resources as your production application, so unless you want severe headaches trying to duplicate configuration and access secrets from multiple places, you really need to run the tasks from inside the cluster.

Our solution: a long running deployment of a CLI tool

In a previous post, I mentioned that I like to create a "CLI" application for each of my main applications. This tool is used to run database migrations, but it also allows you to run any other administrative commands you might need.

The overall solution we've settled on is to create a special "CLI exec host" pod in a deployment, as part of your application release. This pod contains our application's CLI tool for running various administration commands. The pod's job is just to sit there, doing nothing, until we need to run a command.

The CLI tool pod is deployed as part of the application

When we need to run a command, we exec into the container, and run the command.

Kubernetes allows you to open a shell in a running container by using exec (short for executing a command). If you have kubectl configured, you can do this from the command line using something like

kubectl exec --stdin --tty test-app-cli-host -- /bin/bash

Personally, I prefer to exec into a container using the Kubernetes dashboard. You can exec into any running container by selecting the pod and clicking the exec symbol:

Execing into a running container from the Kubernetes dashboard

This gives you a command prompt with the container's shell (which may be the bash shell) or the ash shell for example). From here you can run any commands you like. In the example above I ran the ls command.

Be aware, if you exec into one of your "application" pods, then you could impact your running applications. Obviously that could be Bad™.

At this point you have a shell, in a pod in your Kubernetes cluster so you can run any administrative commands you need to. Obviously you need to be aware of the security implications here—depending on how locked down your cluster is, this may not be something you can or want to do, but it's worked well enough for us!

Creating the CLI exec-host container

We want to deploy the CLI tool inside the exec-host pod as part of our application's standard deployment, so we'll need a Docker container and a Helm chart for it. As in my previous posts, I'll assume that you have already created a .NET Core command-line tool for running commands. In this section I show the Dockerfile I use and the Helm chart for deploying it.

The tricky part in setting this up is that we want to have a container that does nothing, but isn't killed. We don't want Kubernetes to run our CLI tool—we want to do that manually ourselves when we exec into the container, so we can choose the right command etc. But the container has to run something otherwise it will exit, and we won't have anything to exec into. To achieve that, I use a simple bash script.

The keep_alive.sh script

The following script is based on a StackOverflow answer (shocker, I know). It looks a bit complicated, but this script essentially just sleeps for 86,400 seconds (1 day). The extra code ensures there's no delay when Kubernetes tries to kill the pod (for example when we're upgrading a chart) See the StackOverflow answer for a more detailed explanation.

#!/bin/sh
die_func() {
    echo "Terminating"
    exit 1
}

trap die_func TERM

echo "Sleeping..."
# restarts once a day
sleep 86400 &
wait

We'll use this script to keep a pod alive in our cluster so that we can exec into it, while using very few resources (typically couple of MB of memory and 0 CPU!).

The CLi exec-host Dockerfile

For the most part, the Dockerfile for the CLI tool is a standard .NET Core application. The interesting part is the runtime container, so I've used a very basic builder Dockerfile that just does everything in one step.

Don't copy the builder part of this Dockerfile (everything before the ###), instead use an approach that uses layer caching.

# Build standard .NET Core application
FROM mcr.microsoft.com/dotnet/core/sdk:3.1 AS builder
WORKDIR /app

# WARNING: This is completely unoptimised!
COPY . .

# Publish the CLI project to the path /app/output/cli
RUN dotnet publish ./src/TestApp.Cli -c Release -o /app/output/cli

###################

# Runtime image 
FROM mcr.microsoft.com/dotnet/core/aspnet:3.1-alpine

# Copy the background script that keeps the pod alive
WORKDIR /background
COPY ./keep_alive.sh ./keep_alive.sh
# Ensure the file is executable
RUN chmod +x /background/keep_alive.sh

# Set the command that runs when the pod is started
CMD "/background/keep_alive.sh"

WORKDIR /app

# Copy the CLI tool into this container
COPY --from=builder ./app/output/cli .

This Dockerfile does a few things

  • Builds the CLI project in a completely unoptimised way.
  • Uses the ASP.NET Core runtime image as the base deployment container. If your CLI tool doesn't need the ASP.NET Core runtime, you could use the base .NET Core runtime image instead
  • Copies the keep_alive.sh script from the previous section into the background folder.
  • Sets the container CMD to run the keep_alive.sh script. When the container is run, the script will be executed.
  • Change the working directory to /app and copy the CLI tool into the container.

We'll add this Dockerfile to our build process, and tag it as andrewlock/my-test-cli-exec-host. Now we have a Docker image, we need to create a chart to deploy the tool with our main application.

Creating a chart for the cli-exec-host

The only thing we need for our exec-host Chart is a deployment.yaml to create a deployment. We don't need a service (other apps shouldn't be able to call the pod) and we don't need an ingress (we're not exposing any ports externally to the cluster). All we need to do is ensure that a pod is available if we need it.

The deployment.yaml shown below is based on the default template created when you call helm create test-app-cli-exec-host. We don't need any readiness/liveness probes, as we're just using the keep_alive.sh script to keep the pod running, so I removed that section. I added an additional section for injecting environment variables, as we will want our CLI tool to have the same configuration as our other applications/.

Don't worry about the details of this YAML too much. There's a lot of boilerplate in there and a lot of features we haven't touched on that will go unused unless you explicitly configure them. I only decided to show the whole chart for completeness

apiVersion: apps/v1
kind: Deployment
metadata:
  name: {{ include "test-app-cli-exec-host.fullname" . }}
  labels:
    {{- include "test-app-cli-exec-host.labels" . | nindent 4 }}
spec:
  replicas: 1
  selector:
    matchLabels:
      {{- include "test-app-cli-exec-host.selectorLabels" . | nindent 6 }}
  template:
    metadata:
    {{- with .Values.podAnnotations }}
      annotations:
        {{- toYaml . | nindent 8 }}
    {{- end }}
      labels:
        {{- include "test-app-cli-exec-host.selectorLabels" . | nindent 8 }}
    spec:
      {{- with .Values.imagePullSecrets }}
      imagePullSecrets:
        {{- toYaml . | nindent 8 }}
      {{- end }}
      serviceAccountName: {{ include "test-app-cli-exec-host.serviceAccountName" . }}
      securityContext:
        {{- toYaml .Values.podSecurityContext | nindent 8 }}
      containers:
        - name: {{ .Chart.Name }}
          securityContext:
            {{- toYaml .Values.securityContext | nindent 12 }}
          image: "{{ .Values.image.repository }}:{{ .Values.image.tag | default .Chart.AppVersion }}"
          imagePullPolicy: {{ .Values.image.pullPolicy }}
          env:
          {{- $env := merge (.Values.env | default dict) (.Values.global.env | default dict) -}}
          {{ range $k, $v := $env }}
            - name: {{ $k | quote }}
              value: {{ $v | quote }}
          {{- end }}
          resources:
            {{- toYaml .Values.resources | nindent 12 }}
      {{- with .Values.nodeSelector }}
      nodeSelector:
        {{- toYaml . | nindent 8 }}
      {{- end }}
      {{- with .Values.affinity }}
      affinity:
        {{- toYaml . | nindent 8 }}
      {{- end }}
      {{- with .Values.tolerations }}
      tolerations:
        {{- toYaml . | nindent 8 }}
      {{- end }}

We'll need to add a section to the top-level chart's Values.yaml to define the Docker image to use, and optionally override any other settings:

test-app-cli-exec-host:

  image:
    repository: andrewlock/my-test-cli-exec-host
    pullPolicy: IfNotPresent
    tag: ""

  serviceAccount:
    create: false

Our overall Helm chart has now grown to 4 sub-charts: The two "main" applications (the API and message handler service), the CLI job for running database migrations automatically, and the CLI exec-host chart for running ad-hoc commands:

The 4 charts that go into the chart

All that's left to do is to take our exec-host chart for a spin!

Testing it out

We can install the chart using a command like the following:

helm upgrade --install my-test-app-release . \
  --namespace=local \
  --set test-app-cli.image.tag="0.1.1" \
  --set test-app-cli-exec-host.image.tag="0.1.1" \
  --set test-app-api.image.tag="0.1.1" \
  --set test-app-service.image.tag="0.1.1" \
  --debug

After installing the chart, you should see the exec-host deployment and pod in your cluster, sat there happily doing nothing:

Image of the exec-host deployment and pod not doing anything

We can now exec into the container. You could use kubectl if you're command-line-inclined, but I prefer to use the dashboard to click exec to get a shell. I'm normally only trying to run a command or two, so it's good enough!

As you can see in the image below, we have access to our CLI tool from here and can run our ad-hoc commands using, for example, dotnet TestApp.Cli.dll say-hello:

Running an ad-hoc command using the CLI exec-host

Ignore the error at the top of the shell. I think that's because Kubernetes tries to open a Bash shell specifically, but as this is an Alpine container, it uses the Ash shell instead.

And with that, we can now run ad-hoc commands in the context of our cluster whenever we need to. Obviously we don't want to make a habit of that, but having the option is always useful!

Summary

In this post I showed how to create a CLI exec-host to run ad-hoc commands in your Kubernetes cluster by creating a deployment of a pod that contains a CLI tool. The pod contains a script that keeps the container running without using any resources. You can then exec into the pod, and run any necessary commands.

Avoiding downtime in rolling deployments by blocking SIGTERM: Deploying ASP.NET Core applications to Kubernetes - Part 11

$
0
0
Avoiding downtime in rolling deployments by blocking SIGTERM

This post is a bit of a bonus—I was originally going to include it as one of my smaller tips in the final post of the series, but it's unexpected enough that I think it's worth it having its own post.

This post deals with a problem whereby you see 502 error responses from your applications when they're being upgraded using a rolling-upgrade deployment in Kubernetes. If that's surprising, it should be—that's exactly what a rolling-update is supposed to avoid!

In this post I describe the problem, explain why it happens, and show how I worked around it by hooking into ASP.NET Core's IHostApplicationLifetime abstraction.

The setup: a typical ASP.NET Core deployment to Kubernetes

In this series I've frequently described a common pattern for deploying ASP.NET Core applications:

  • Your application is deployed in a pod, potentially with sidecar or init containers.
  • The pod is deployed and replicated to multiple nodes using a Kubernetes deployment.
  • A Kubernetes service acts as the load balancer for the pods, so that requests are sent to one of the pods.
  • An ingress exposes the service externally, so that clients outside the cluster can send requests to your application.
  • The whole setup is defined in Helm Charts, deployed in a declarative way.
Sample application consisting of an ingress, a service, and 3 pods
The sample application consisting of an ingress, a service, and 3 pods

When you create a new version of your application, and upgrade your application using Helm, Kubernetes performs a rolling update of your pods. This ensures that there are always functioning Pods available to handle requests by slowly adding instances of the new version while keeping the old version around for a while.

Animated gif of a new deployment using rolling update strategy

At least, that's the theory…

The problem: rolling updates cause 502s

The problem I ran into when first trying rolling-updates was that it didn't seem to work! After upgrading a chart, and confirming that there the new pods were deployed and functioning I would see failed requests for 10-20s after each deploy!

Image of 502s

Um…ok…This really shouldn't happen. The whole point of using rolling-updates is to avoid this issue. 502 responses in Kubernetes often mean there's a problem somewhere between the Ingress and your application pods. So what's going on?

The cause: the NGINX ingress controller

The root of the problem was apparently the NGINX ingress controller we were using in our Kubernetes cluster. There's a lot of documentation about how this works, but I'll give a quick overview here.

The NGINX ingress controller, perhaps unsurprisingly, manages the ingresses for your Kubernetes cluster by configuring instances of NGINX in your cluster. The NGINX instances run as pods in your cluster, and receive all the inbound traffic to your cluster. From there they forward on the traffic to the appropriate services (and associated pods) in your cluster.

Each node runs an instance of the NGINX reverse-proxy. It monitors the Ingresses in the application, and is configured to forward requests to the pods

The Ingress controller is responsible for updating the configuration of those NGINX reverse-proxy instances whenever the resources in your Kubernetes cluster change.

For example, remember that you typically deploy an ingress manifest with your application. Deploying this resource allows you to expose your "internal" Kubernetes service outside the cluster, by specifying a hostname and path that should be used.

The ingress controller is responsible for monitoring all these ingress "requests" as well as all the endpoints (pods) exposed by referenced services, and assembling them into an NGINX configuration file (nginx.conf) that the NGINX pods can use to direct traffic.

So what went wrong?

Unfortunately, rebuilding all that configuration is an expensive operation. For that reason, the ingress controller only applies updates to the NGINX configuration every 30s by default. That was causing the following sequence of events during a deployment upgrade:

  1. New pods are deployed, old pods continue running.
  2. When the new pods are ready, the old pods are marked for termination.
  3. Pods marked for termination receive a SIGTERM notification. This causes the pods to start shutting down.
  4. The Kubernetes service observes the pod change, and removes them from the list of available endpoints.
  5. The ingress controller observes the change to the service and endpoints.
  6. After 30s, the ingress controller updates the NGINX pods' config with the new endpoints.

The problem lies between steps 5 and 6. Before the ingress controller updates the NGINX config, NGINX will continue to route requests to the old pods! As those pods typically will shut down very quickly when requested by Kubernetes, that means incoming requests get routed to non-existent pods, hence the 502 response.

During a rolling deploy, the NGINX reverse-proxy continues to point to the old pods

It's worth noting that we first hit this problem over 3 years ago now, so my understanding and information may be a little out of date. In particular, this section in the documentation implies that this should no longer be a problem! If that's the case, you can discard this post entirely. I still use the solution described in here due to an "if it ain't broke, don't fix it" attitude!

Fixing the problem: delaying application termination

When we first discovered the problem, we had 3 options we could see:

  1. Use a different ingress controller that doesn't have this problem.
  2. Decrease the time before reloading the NGINX config.
  3. Don't shut pods down immediately on termination. Allow them to continue to handle requests for 30s until the NGINX config is updated.

Option 1 was very heavy-handed, had other implications, and wasn't an option on the table, so we can scratch that! Option 2 again, has broader (performance) implications, and wouldn't actually fix the problem, it would only mitigate it. That left option 3 as the easiest way to work around the issue.

The idea is that when Kubernetes asks for a pod to terminate, we ignore the signal for a while. We note that termination was requested, but we don't actually shut down the application for 30s, so we can continue to handle requests. After 30s, we gracefully shut down.

Instead of terminating immediately, the old pods remain until the NGINX config updates

Note that Kubernetes (and Linux in general) uses two different "shutdown" signals: SIGTERM and SIGKILL. There's lots of information on the differences, but the simple explanation is that SIGTERM is where the OS asks the process to stop. With SIGKILL it's not a question; the OS just kills the process. So SIGTERM gives a graceful shutdown, and SIGKILL is a hard stop.

So how can we achieve that in an ASP.NET Core application? The approach I used was to hook into the IHostApplicationLifetime abstraction.

Hooking into IHostApplicationLifetime to delay shutdown

IHostApplicationLifetime (or IApplicationLifetime in pre-.NET Core 3.x) looks something like this:

namespace Microsoft.Extensions.Hosting
{
    public interface IHostApplicationLifetime
    {
        CancellationToken ApplicationStarted { get; }
        CancellationToken ApplicationStopping { get; }
        CancellationToken ApplicationStopped { get; }
        void StopApplication();
    }
}

This abstraction is registered by default in the generic Host and can be used to both stop the application, or to be notified with the application is stopping or has shut down. I looked at the role of this abstraction in the startup and shutdown process in great detail in a previous post.

The key property for us in this case is the ApplicationStopping property. Subscribers to this property's CancellationToken can run a callback when the SIGTERM signal is received (e.g. when you press ctrl+c in a console, or Kubernetes terminates the pod).

To delay the shutdown process, we can register a callback on ApplicationStopping. You can do this, for example, in Startup.Configure(), where the IHostApplicationLifetime is available to be injected, or you could configure it anywhere else in your app that is called once on app startup, and can access DI services, such as an IHostedService.

In ASP.NET Core 3.0, I typically use "startup" tasks based on IHostedService, as described in this post. That's the approach I'll show in this post.

The simplest implementation looks like the following:

public class ApplicationLifetimeService: IHostedService
{
    readonly ILogger _logger;
    readonly IHostApplicationLifetime _applicationLifetime;

    public ApplicationLifetimeService(IHostApplicationLifetime applicationLifetime, ILogger<ApplicationLifetimeService> logger)
    {
        _applicationLifetime = applicationLifetime;
        _logger = logger;
    }

    public Task StartAsync(CancellationToken cancellationToken)
    {
        // register a callback that sleeps for 30 seconds
        _applicationLifetime.ApplicationStopping.Register(() =>
        {
            _logger.LogInformation("SIGTERM received, waiting for 30 seconds");
            Thread.Sleep(30_000);
            _logger.LogInformation("Termination delay complete, continuing stopping process");
        });
        return Task.CompletedTask;
    }

    // Required to satisfy interface
    public Task StopAsync(CancellationToken cancellationToken) => Task.CompletedTask;
}

Register the hosted service in Startup.ConfigureServices:

public void ConfigureServices(IServiceCollection services)
{
    // other config...
    services.AddHostedService<ApplicationLifetimeService>();
    services.Configure<HostOptions>(opts => opts.ShutdownTimeout = TimeSpan.FromSeconds(45));
}

If you run an application with this installed, and hit ctrl+c, then you should see something like the following, and the app takes 30s to shutdown:

# Normal application startup...
info: Microsoft.Hosting.Lifetime[0]
      Now listening on: https://localhost:5001
info: Microsoft.Hosting.Lifetime[0]
      Application started. Press Ctrl+C to shut down.
# ...
# Ctrl+C pushed to trigger application shutdown
info: MyTestApp.ApplicationLifetimeService[0]
      SIGTERM received, waiting for 30 seconds
info: MyTestApp.ApplicationLifetimeService[0]
      Termination delay complete, continuing stopping process
info: Microsoft.Hosting.Lifetime[0]
      Application is shutting down...
# App finally shuts down after 30s

Obviously it would be very annoying for this to happen every time you shutdown your app locally, so I typically have this controlled by a setting, and override the setting locally to disable it

That's all we need in our applications, but if you try deploying this to Kubernetes as-is you might be disappointed. It almost works, but Kubernetes will start hard SIGKILLing your pods!

Preventing Kubernetes from killing your pods

When Kubernetes sends the SIGTERM signal to terminate a pod, it expects the pod to shutdown in a graceful manner. If the pod doesn't, then Kubernetes gets bored and SIGKILLs it instead. The time between SIGTERM and SIGKILL is called the terminationGracePeriodSeconds.

By default, that's 30 seconds. Given that we've just added a 30s delay after SIGTERM before our app starts shutting down, it's now pretty much guaranteed that our app is going to be hard killed. To avoid that, we need to extend the terminationGracePeriodSeconds.

You can increase this value by setting it in your deployment.yaml Helm Chart. The value should be indented to the same depth as the containers element in the template:spec, for example:

apiVersion: extensions/v1beta1
kind: Deployment
metadata:
  name: "{{ template "name" . }}"
spec:
  replicas: {{ .Values.replicaCount }}
  strategy:
    type: RollingUpdate
  template:
    metadata:
      labels:
        app: {{ template "name" . }}
        release: "{{ .Release.Name }}"
    spec:
      # Sets the value to 60s, overridable by passing in Values
      terminationGracePeriodSeconds: {{ default 60 .Values.terminationGracePeriodSeconds }}
      containers:
      - name: {{ .Chart.Name }}
        image: "{{ .Values.image.name }}:{{ .Values.image.tag }}"
        # ... other config

In this example I set the terminationGracePeriodSeconds to 60s, to give our app time to shutdown. I also made the value overridable so you can change the terminationGracePeriodSeconds value in your values.yaml or at the command line at deploy time.

With all that complete, you should no longer see 502 errors when doing rolling updates, and your application can still shutdown gracefully. It may take a bit longer than previously, but at least there's no errors!

Summary

In this post I described a problem where the NGINX ingress controller doesn't immediately update its list of pods for a service during a rolling update. This means the reverse-proxy continues to send traffic to pods that have been stopped, resulting in 502 errors. To work around this issue, we use the IHostApplicationLifetime abstraction in ASP.NET Core to "pause" app shutdown when the SIGTERM shutdown signal is received. This ensures your app remains alive until the NGINX configuration has been updated.

Tips, tricks, and edge cases: Deploying ASP.NET Core applications to Kubernetes - Part 12

$
0
0
Tips, tricks, and edge cases

This is the last post in the series, in which I describe a few of the smaller pieces of advice, tips, and info I found when running applications on Kubernetes. Many of these are simple things to keep in mind when moving from running primarily on Windows to Linux. Others are related to running in a clustered/web farm environment. A couple of tips are specifically Kubernetes related.

It's not quite a checklist of things to think about, but hopefully you find them helpful. Feel free to add your own notes to the comments, and I may expand this post to include them. If there's any specific posts you'd like to see me write on the subject of deploying ASP.NET Core apps to Kubernetes let me know, and I'll consider adding to this series if people find it useful.

Be careful about paths

This is a classic issue when moving from Windows, with its back-slash \ path separator to Linux with its forward-slash / directory separator. Even if you're currently only running on one or the other, I strongly recommend avoiding using these characters directly in any path-stings in your application. Instead use PathSeparator.

For example instead of:

var path = "some\long\path";

use something like:

var path1 = "some" + Path.PathSeparator + "long" + Path.PathSeparator + "path";
// or
var path2 = Path.Combine("some", "long", "path");

Really, be careful about paths!

Another thing to remember is casing. Windows is case insensitive, so if you have an appsettings.json file, but you try and load appSettings.json, Windows will have no problem loading the file. Try that on Linux, with its case sensitive filename, and your file won't be found.

This one has caught me several times, leaving me stumped as to why my configuration file wasn't being loaded. In each case, I had a casing mismatch between the file referenced in my code, and the real filename.

Treat your Docker images as immutable artefacts

One of the central tenants of deploying Docker images is to treat them as immutable artefacts. Build the Docker images in your CI pipeline and then don't change them as you deploy them to other environments. Also don't expect to be able to remote into production and tweak things!

I've seen some people re-building Docker images as they move between testing/staging/production environments, but that loses a lot of the benefits that you can gain by treating the images as fixed after being built. By rebuilding Docker images in each environment, you're wasting resources recreating images which are identical, and if they're not identical then you have a problem—you haven't really tested the software you're releasing to production!

If you need behavioural differences between different environments, drive that through configuration changes instead. The downside is that you can't tweak things in production, but that's also the plus side too. Your environment becomes much easier to reason about if you know noone has changed it.

Manage your configuration with files, environment variables, and secrets

The ASP.NET Core configuration system is very powerful, enabling you to easily load configuration from multiple sources and merge it into a single dictionary of key value pairs. For our applications deployed to Kubernetes, we generally load configuration values from 3 different sources:

  • JSON files
  • Environment Variables
  • Secrets

JSON files

We use JSON files for configuration values that are static values. They're embedded in the Docker container as part of the build and should not contain sensitive values.

We use JSON files for basic configuration that is required to run the application. Ideally a new developer should be able to clone the repository and dotnet run the application (or F5 from Visual Studio) and the app should have the minimally required config to run locally.

Separately, we have a script for configuring the local infrastructural prerequisites, such as a postgres database accessible at a well know local port etc. These values are safe to embed in the config files as they're only for local development.

You can use override files for different environments such as appsettings.Development.json, as in the default ASP.NET Core templates, to override (non-sensitive) values in other environments.

As you've seen in previous posts in this series, I typically deploy several ASP.NET Core apps together, that make up a single logical application. At a minimum, there's typically an API app, a message handling app, and a CLI tool.

Multiple applications make up a single chart

These applications typically have a lot of common configuration, so we use an approach I've described in a previous post, where we have a sharedsettings.json file (with environment-specific overrides) that are shared between all the applications, with app-specific appsettings.json that override them:

Sharing settings between applications

You can read more about how to achieve this setup here and here.

Environment variables

We use application JSON files for configuring the "base" config that an application needs to run locally, but we use environment variables, configured at deploy time, to add Kubernetes-specific values, or values that are only known at runtime. I showed how to inject environment variables into your Kubernetes pods in a previous post. This is the primary way to override your JSON file settings when running in Kubernetes.

Configuring applications using environment variables is one of the tenants of the 12 factor app, but it's easy to go overboard. The downside I've found is that it's often harder to track changes to environment variables, depending on your release pipeline, and it can make things harder to debug.

Personally I generally prefer including configuration in the JSON files if possible. The downside to storing config in JSON files is you need to create a completely new build of the application to change a config value, whereas with environment variables you can quickly redeploy with the new value. It's really a judgement call which is best, just be aware of the trade offs.

Secrets

Neither JSON files or Environment variables are for storing sensitive data. JSON files are a definite no-no: they are embedded in the Docker containers (and are generally stored in source control), so anyone that can pull your Docker images can access the values. Environment variables are less obvious—they're often suggested as a way to add secrets to your Docker containers, but this isn't always a great option either.

Many tools (such as the Kubernetes dashboard) will display environment variables to users. That can easily leak secrets to anyone just browsing the dashboard. Now, clearly, if someone is browsing your Kubernetes dashboard, then they already have privileged access, but I'd still argue that your API keys shouldn't be there for everyone to see!

The Kubernetes dashboard exposes container environment variables

Instead, we store secrets using a separate configuration provider, such as Azure Key Vault or AWS Secrets Manager. This avoids exposing the most sensitive details to anyone who wanders by. I wrote about how to achieve this with AWS Secrets Manager in a previous post.

Kubernetes does have "native" secrets support, but this wasn't really fit for purpose last I checked. All this did was store secrets in base64, but didn't protect them. I believe there's been some headway on adding a secure backend for the Secrets management, but I haven't found a need to explore this again yet.

Data-protection keys

The data-protection system in ASP.NET Core is used to securely store data that needs to be sent to an untrusted third-party. The canonical example of this is authentication-cookies. These need to be encrypted before they're sent to the client. The data-protection system is responsible for encrypting and decrypting these cookies.

If you don't configure data-protection system correctly, you'll find that users are logged out whenever your application restart, or whenever users are routed to a different pod in your Kubernetes cluster. As a worst case, you could also expose the data-protection keys for your application, meaning anyone could impersonate users on your system. Not good!

ASP.NET Core comes with some sane defaults for the data-protection system, but you'll need to change those defaults when deploying your application to Kubernetes. In short, you'll need to configure your application to store its data-protection keys in a central location that's accessible by all the separate instances of your application.

There are various plugins for achieving this. For example, you could persist the keys to Azure Blob Storage, or to Redis. We use an S3 bucket, and encrypt the keys at rest using AWS KMS.

There are a few subtle gotchas with configuring the data-protection system in a clustered environment. I'll write a separate post(s) detailing our approach, as there are a few things to consider.

Forwarding Headers and PathBase

ASP.NET Core 2.0 brought the ability for Kestrel to act as an "Edge" server, so you could expose it directly to the internet, instead of hosting behind a reverse proxy. when running in a Kubernetes cluster, you will likely be running behind a reverse proxy.

As I mentioned in my first post, you expose your applications and APIs outside your cluster by using an ingress. This ingress defines the hostname and paths your application should be exposed at. An ingress controller takes care of mapping that declarative request to an implementation. In some implementations, those requests are translated directly to infrastructural configuration such as a load balancer (e.g. an ALB on AWS). In other implementations, the requests may be mapped to a reverse proxy running inside your cluster (e.g. an NGINX instance).

If you're running behind a reverse proxy, then you need to make sure your application is configured to use the "forwarded headers" added by the reverse proxy. For example the defacto standard headers X-Forwarded-Proto and X-Forwarded-Host headers are added by reverse proxies to indicate what the original request details were, before the reverse proxy forwarded the request to your pod.

This is another area where the exact approach you need to take depends on your specific situation. The documentation has some good advice here, so I recommend reading through and finding the configuration that applies to your situation. One of the hardest parts is testing your setup, as often your local environment won't be the same as your production environment!

One specific area to pay attention to is PathBase. If you're hosting your applications at a sub-path of your hostname e.g. the my-app portion of https://example.org/my-app/, you may need to look into the UsePathBase() extension method, or one of the other approaches in the documentation.

Consider extending the shutdown timeout

This one was actually sufficiently interesting that I moved it to a post in its own right. The issue was that during rolling deployments, our NGINX ingress controller configuration would send traffic to terminated pods. Our solution was to delay the shutdown of pods during termination, so they would remain available. I discuss both this problem and the solution in detail in the previous post.

Kubernetes service location

One of the benefits you get for "free" with Kubernetes is in-cluster service-location. Each Kubernetes Service in a cluster gets a DNS record of the format:

[service-name].[namespace].svc.[cluster-domain]

Where [service-name] is the name of the individual service, e.g. my-products-service, [namespace] is the Kubernetes namespace in which it was installed, e.g. local, and [cluster-domain] is the configured local domain for your Kubernetes cluster, typically cluster.local.

So for example, say you have a products-service service, and a search service installed in the prod namespace. The search service needs to make an HTTP request to the products-service, for example at the path /search-products. You don't need to use any third-party service location tools here, instead you can send the request directly to http://products-service.prod.svc.cluster.local/search-products. Kubernetes will resolve the DNS to the products-service, and all the communication remains in-cluster.

Helm delete --purge

This final tip is for when things go wrong installing a Helm Chart into your cluster. The chances are, you aren't going to get it right the first time you install a chart. You'll have a typo somewhere, incorrectly indented some YAML, or forgotten to add some required details. It's just the way it goes.

If things are bad enough, especially if you've messed up a selector in your Helm Charts then you might find you can't deploy a new version of your chart. In that case, you'll need to delete the release from the cluster. However, don't just run helm delete my-release, instead use:

helm delete --purge my-release

Without the --purge argument, Helm keeps the configuration for the failed chart around as a ConfigMap in the cluster. This can cause issues when you've deleted a release due to mistakes in the chart definition. Using --purge clears the ConfigMaps, and gives you a clean-slate next time you install the Helm Chart in your Cluster.

Summary

In this post I provided a few tips and tricks on deploying to Kubernetes, as well as things to think about and watch out for. Many of these are related to moving to Linux environments when coming from Windows, or moving to a clustered environment. There are also a few Kubernetes-specific tricks in there too.

Applying the MVC design pattern to Razor Pages

$
0
0
Applying the MVC design pattern to Razor Pages

With the recent release of .NET 5.0, I'm hard at work updating the code and content of the second edition of my book ASP.NET Core in Action, Second Edition. This post gives you a sample of what you can find in the book. If you like what you see, please take a look - for now you can even get a 40% discount by entering the code bllock2 into the discount code box at checkout at manning.com. On top of that, you'll also get a copy of the first edition, free!

The Manning Early Access Program (MEAP) provides you full access to books as they are written, You get the chapters as they are produced, plus the finished eBook as soon as it’s ready, and the paper book long before it's in bookstores. You can also interact with the author (me!) on the forums to provide feedback as the book is being written. All of the chapters are currently available in MEAP, so now is the best time to grab it!

In this article we look in greater depth at how the MVC design pattern applies to Razor Pages in ASP.NET Core. This will also help clarify the role of various features of Razor Pages.

Applying the MVC design pattern to Razor Pages

If you’re reading this, you’re probably familiar with the MVC pattern as typically used in web applications; Razor Pages use this pattern. But ASP.NET Core also includes a framework called ASP.NET Core MVC. This framework (unsurprisingly) very closely mirrors the MVC design pattern, using controllers and action methods in place of Razor Pages and page handlers. Razor Pages builds directly on top of the underlying ASP.NET Core MVC framework, using the MVC framework “under the hood” for their behavior.

If you prefer, you can avoid Razor Pages entirely, and work with the MVC framework directly in ASP.NET Core. This was the only option in early versions of ASP.NET Core and the previous version of ASP.NET.

ASP.NET Core implements Razor Page endpoints using a combination of the EndpointRoutingMiddleware (often referred to simply as RoutingMiddleware) and EndpointMiddleware, as shown in figure 1. Once a request has been processed by earlier middleware (and assuming none of them handle the request and short-circuit the pipeline), the routing middleware will select which Razor Page handler should be executed, and the Endpoint middleware executes the page handler.

Image showing a middleware pipeline consisting of 4 middleware components.
Figure 1. The middleware pipeline for a typical ASP.NET Core application. The request is processed by each middleware in sequence. If the request reaches the routing middleware, the middleware selects an endpoint, such as a Razor Page, to execute. The endpoint middleware executes the selected endpoint.

Middleware often handles cross-cutting concerns or narrowly defined requests, such as requests for files. For requirements that fall outside of these functions, or that have many external dependencies, a more robust framework is required. Razor Pages (and/or ASP.NET Core MVC) can provide this framework, allowing interaction with your application’s core business logic, and the generation of a UI. It handles everything from mapping the request to an appropriate controller to generating the HTML or API response.

In the traditional description of the MVC design pattern, there’s only a single type of model, which holds all the non-UI data and behavior. The controller updates this model as appropriate and then passes it to the view, which uses it to generate a UI.

One of the problems when discussing MVC is the vague and ambiguous terms that it uses, such as “controller” and “model.” Model, in particular, is such an overloaded term that it’s often difficult to be sure exactly what it refers to—is it an object, a collection of objects, an abstract concept? Even ASP.NET Core uses the word “model” to describe several related, but different, components, as you’ll see shortly.

Directing A Request To A Razor Page And Building A Binding Model

The first step when your app receives a request is routing the request to an appropriate Razor Page handler. Let’s think about the category to-do list page again, from Listing 1 (repeated below).

public class CategoryModel : PageModel
{
    private readonly ToDoService _service;
    public CategoryModel(ToDoService service)
    {
        _service = service;
    }

    public ActionResult OnGet(string category)
    {
        Items = _service.GetItemsForCategory(category);
        return Page();
    }

    public List<ToDoListModel> Items { get; set; }
}
Listing 1. An example Razor Page for viewing all to-do items in a given category

On this page, you’re displaying a list of items that have a given category label. If you’re looking at the list of items with a category of “Simple,” you’d make a request to the /category/Simple path.

Routing takes the headers and path of the request, /category/Simple, and maps it against a preregistered list of patterns. These patterns match a path to a single Razor Page and page handler.

TIP I’m using the term Razor Page to refer to the combination of the Razor view and the PageModel that includes the page handler. Note that that PageModel class is not the “model” we’re referring to when describing the MVC pattern. It fulfills other roles, as you will see later in this section.

Once a page handler is selected, the binding model (if applicable) is generated. This model is built based on the incoming request, the properties of the PageModel marked for binding, and the method parameters required by the page handler, as shown in figure 2. A binding model is normally one or more standard C# objects, with properties that map to the requested data.

DEFINITION A binding model is one or more objects that act as a “container” for the data provided in a request that’s required by a page handler.

Image showing a request being routed to a Razor Page handler.
Figure 2. Routing a request to a controller and building a binding model. A request to the /category/Simple URL results in the CategoryModel.OnGet page handler being executed, passing in a populated binding model, category.

In this case, the binding model is a simple string, category, which is “bound” to the "Simple" value. This value is provided in the request URL’s path. A more complex binding model could also have been used, where multiple properties were populated.

This binding model in this case corresponds to the method parameter of the OnGet page handler. An instance of the Razor Page is created using its constructor, and the binding model is passed to the page handler when it executes, so it can be used to decide how to respond. For this example, the page handler uses it to decide which to-do items to display on the page.

Executing A Handler Using The Application Model

The role of the page handler as the controller in the MVC pattern is to coordinate the generation of a response to the request its handling. That means it should perform only a limited number of actions. In particular, it should

  • Validate that the data contained in the binding model provided is valid for the request.
  • Invoke the appropriate actions on the application model using services.
  • Select an appropriate response to generate based on the response from the application model.
Image showing a page handler calling methods in the application model
Figure 3. When executed, an action will invoke the appropriate methods in the application model.

Figure 3 shows the page handler invoking an appropriate method on the application model. Here, you can see that the application model is a somewhat abstract concept that encapsulates the remaining non-UI part of your application. It contains the domain model, a number of services, and the database interaction.

DEFINITION The domain model encapsulates complex business logic in a series of classes that don’t depend on any infrastructure and can be easily tested.

The page handler typically calls into a single point in the application model. In our example of viewing a to-do list category, the application model might use a variety of services to check whether the current user is allowed to view certain items, to search for items in the given category, to load the details from the database, or to load a picture associated with an item from a file.

Assuming the request is valid, the application model will return the required details to the page handler. It’s then up to the page handler to choose a response to generate.

Building Html Using The View Model

Once the page handler has called out to the application model that contains the application business logic, it’s time to generate a response. A view model captures the details necessary for the view to generate a response.

DEFINITION A view model is all the data required by the view to render a UI. It’s typically some transformation of the data contained in the application model, plus extra information required to render the page, for example the page’s title.

The term view model is used extensively in ASP.NET Core MVC, where it typically refers to a single object that is passed to the Razor view to render. However, with Razor Pages, the Razor view can access the Razor Page’s page model class directly. Therefore, the Razor Page PageModel typically acts as the view model in Razor Pages, with the data required by the Razor view exposed via properties, as you saw previously in Listing 1.

NOTE Razor Pages use the PageModel class itself as the view model for the Razor view, by exposing the required data as properties.

The Razor view uses the data exposed in the page model to generate the final HTML response. Finally, this is sent back through the middleware pipeline and out to the user’s browser, as shown in figure 4.

Passing the PageModel to a Razor View, which uses it to generate HTML
Figure 4. The page handler builds a view model by setting properties on the PageModel. It’s the view that generates the response.

It’s important to note that although the page handler selects whether to execute the view, and the data to use, it doesn’t control what HTML is generated. It’s the view itself that decides what the content of the response will be.

Do Razor Pages use MVC or MVVM?

Occasionally I’ve seen people describe Razor Pages as using the Model-View-View Model (MVVM) design pattern, rather than the MVC design pattern. Personally, I don’t agree, but it’s worth being aware of the differences.

MVVM is a UI pattern that is often used in mobile apps, desktop apps, and in some client-side frameworks. It differs from MVC in that there is a bi-directional interaction between the view and the view model. The view model tells the view what to display, but the view can also trigger changes directly on the view model. It’s often used with two-way databinding where a view model is “bound” to a view.

Some people consider the Razor Pages PageModel to be filling this role, but I’m not convinced. Razor Pages definitely seems based on the MVC pattern to me (it’s based on the ASP.NET Core MVC framework after all!) and doesn’t have the same “two-way binding” that I would expect with MVVM.

Putting It All Together: A Complete Razor Page Request

Now that you’ve seen each of the steps that goes into handling a request in ASP.NET Core using Razor Pages, let’s put it all together from request to response. Figure 5 shows how the steps combine to handle the request to display the list of to-do items for the “Simple” category. The traditional MVC pattern is still visible in Razor Pages, made up of the page handler (controller), the view, and the application model.

Routing a request to a page handler, calling into the domain model, and using a view to generate HTML
Figure 5 A complete Razor Pages request for the list of to-dos in the “Simple” category.

By now, you might be thinking this whole process seems rather convoluted—so many steps to display some HTML! Why not allow the application model to create the view directly, rather than having to go on a dance back and forth with the page handler method?

The key benefit throughout this process is the separation of concerns:

  • The view is responsible only for taking some data and generating HTML.
  • The application model is responsible only for executing the required business logic.
  • The page handler (controller) is responsible only for validating the incoming request and selecting which response is required, based on the output of the application model.

By having clearly defined boundaries, it’s easier to update and test each of the components without depending on any of the others. If your UI logic changes, you won’t necessarily have to modify any of your business logic classes, so you’re less likely to introduce errors in unexpected places.

The dangers of tight coupling

Generally speaking, it’s a good idea to reduce coupling between logically separate parts of your application as much as possible. This makes it easier to update your application without causing adverse effects or requiring modifications in seemingly unrelated areas. Applying the MVC pattern is one way to help with this goal.

As an example of when coupling rears its head, I remember a case a few years ago when I was working on a small web app. In our haste, we had not properly decoupled our business logic from our HTML generation code, but initially there were no obvious problems—the code worked, so we shipped it!

A few months later, someone new started working on the app, and immediately “helped” by renaming an innocuous spelling error in a class in the business layer. Unfortunately, the names of those classes had been used to generate our HTML code, so renaming the class caused the whole website to break in users’ browsers! Suffice it to say, we made a concerted effort to apply the MVC pattern after that, and ensure we had a proper separation of concerns.

The examples shown in this article demonstrate the bulk of the Razor Pages functionality. It has additional features, such as the filter pipeline, and more advanced behavior around binding models, but the overall behavior of the system is the same.

How the MVC design pattern applies when you’re generating machine-readable responses using Web API controllers is, for all intents and purposes, identical, apart from the final result generated (I discuss this in depth in the book).

Summary

That’s all for this article. If you want to see more of the book’s contents, you can preview them on our browser-based liveBook platform here. Don’t forget to save 40% with code bllock2 at manning.com.


Using Quartz.NET with ASP.NET Core and worker services

$
0
0
Using Quartz.NET with ASP.NET Core and worker services

This is an update to a post from 18 months ago in which I described how to use Quartz.NET to run background tasks by creating an an ASP.NET Core hosted service.

There's now an official package, Quartz.Extensions.Hosting from Quartz.NET to do that for you, so adding Quartz.NET to your ASP.NET Core or generic-host-based worker service is much easier. This post shows how to use that package instead of the "manual" approach in my old post.

I also discuss Quartz.NET in the second edition of my book, ASP.NET Core in Action. For now you can even get a 40% discount by entering the code bllock2 into the discount code box at checkout at manning.com.

I show how to add the Quartz.NET HostedService to your app, how to create a simple IJob, and how to register it with a trigger.

Introduction - what is Quartz.NET?

As per their website:

Quartz.NET is a full-featured, open source job scheduling system that can be used from smallest apps to large scale enterprise systems.

It's an old staple of many ASP.NET developers, used as a way of running background tasks on a timer, in a reliable, clustered, way. Using Quartz.NET with ASP.NET Core is pretty similar - Quartz.NET supports .NET Standard 2.0, so you can easily use it in your applications.

Quartz.NET has three main concepts:

  • A job. This is the background tasks that you want to run.
  • A trigger. A trigger controls when a job runs, typically firing on some sort of schedule.
  • A scheduler. This is responsible for coordinating the jobs and triggers, executing the jobs as required by the triggers.

ASP.NET Core has good support for running "background tasks" via way of hosted services. Hosted services are started when your ASP.NET Core app starts, and run in the background for the lifetime of the application. Quartz.NET version 3.2.0 introduced direct support for this pattern with the Quartz.Extensions.Hosting package. Quartz.Extensions.Hosting can be used either with ASP.NET Core applications, or with "generic host" based worker-services.

There is also a Quartz.AspNetCore package that builds on the Quartz.Extensions.Hosting. It primarily adds health-check integration, though health-checks can also be used with worker-services too!

While it's possible to create a "timed" background service, (that runs a tasks every 10 minutes, for example), Quartz.NET provides a far more robust solution. You can ensure tasks only run at specific times of the day (e.g. 2:30am), or only on specific days, or any combination of these by using a Cron trigger. Quartz.NET also allows you to run multiple instances of your application in a clustered fashion, so that only a single instance can run a given task at any one time.

The Quartz.NET hosted service takes care of the scheduler part of Quartz. It will run in the background of your application, checking for triggers that are firing, and running the associated jobs as necessary. You need to configure the scheduler initially, but you don't need to worry about starting or stopping it, the IHostedService manages that for you.

In this post I'll show the basics of creating a Quartz.NET job and scheduling it to run on a timer in a hosted service.

Installing Quartz.NET

Quartz.NET is a .NET Standard 2.0 NuGet package, so it should be easy to install in your application. For this test I created a worker service project. You can install the Quartz.NET hosting package using dotnet add package Quartz.Extensions.Hosting. If you view the .csproj for the project, it should look something like this:

<Project Sdk="Microsoft.NET.Sdk.Worker">

  <PropertyGroup>
    <TargetFramework>net5.0</TargetFramework>
    <UserSecretsId>dotnet-QuartzWorkerService-9D4BFFBE-BE06-4490-AE8B-8AF1466778FD</UserSecretsId>
  </PropertyGroup>

  <ItemGroup>
    <PackageReference Include="Microsoft.Extensions.Hosting" Version="5.0.0" />
    <PackageReference Include="Quartz.Extensions.Hosting" Version="3.2.3" />
  </ItemGroup>
</Project>

This adds the hosted service package, which brings in the main Quartz.NET package with in. Next we need to register the Quartz services and the Quartz IHostedService in our app.

Adding the Quartz.NET hosted service

You need to do two things to register the Quartz.NET hosted service:

  • Register the Quartz.NET required services with the DI container
  • Register the hosted service

In ASP.NET Core applications you would typically do both of these in the Startup.ConfigureServices() method. Worker services don't use Startup classes though, so we register them in the ConfigureServices method on the IHostBuilder in Program.cs:

public class Program
{
    public static void Main(string[] args)
    {
        CreateHostBuilder(args).Build().Run();
    }

    public static IHostBuilder CreateHostBuilder(string[] args) =>
        Host.CreateDefaultBuilder(args)
            .ConfigureServices((hostContext, services) =>
            {
                // Add the required Quartz.NET services
                services.AddQuartz(q =>  
                {
                    // Use a Scoped container to create jobs. I'll touch on this later
                    q.UseMicrosoftDependencyInjectionScopedJobFactory();
                });

                // Add the Quartz.NET hosted service

                services.AddQuartzHostedService(
                    q => q.WaitForJobsToComplete = true);

                // other config
            });
}

There's a couple of points of interest here:

  • UseMicrosoftDependencyInjectionScopedJobFactory: this tells Quartz.NET to register an IJobFactory that creates jobs by fetching them from the DI container. The Scoped part means that your jobs can use scoped services, not just singleton or transient services, which is a common requirement.
  • WaitForJobsToComplete: When shutdown is requested, this setting ensures that Quartz.NET waits for the jobs to end gracefully before exiting.

You might be wondering why you need to call AddQuartz() and AddQuartzHostedService(). That's because Quartz.NET itself isn't tied to the hosted service implementation. You're free to run the Quartz scheduler yourself, as shown in the documentation.

If you run your application now, you'll see the Quartz service start up, and dump a whole lot of logs to the console:

info: Quartz.Core.SchedulerSignalerImpl[0]
      Initialized Scheduler Signaller of type: Quartz.Core.SchedulerSignalerImpl
info: Quartz.Core.QuartzScheduler[0]
      Quartz Scheduler v.3.2.3.0 created.
info: Quartz.Core.QuartzScheduler[0]
      JobFactory set to: Quartz.Simpl.MicrosoftDependencyInjectionJobFactory
info: Quartz.Simpl.RAMJobStore[0]
      RAMJobStore initialized.
info: Quartz.Core.QuartzScheduler[0]
      Scheduler meta-data: Quartz Scheduler (v3.2.3.0) 'QuartzScheduler' with instanceId 'NON_CLUSTERED'
  Scheduler class: 'Quartz.Core.QuartzScheduler' - running locally.
  NOT STARTED.
  Currently in standby mode.
  Number of jobs executed: 0
  Using thread pool 'Quartz.Simpl.DefaultThreadPool' - with 10 threads.
  Using job-store 'Quartz.Simpl.RAMJobStore' - which does not support persistence. and is not clustered.

info: Quartz.Impl.StdSchedulerFactory[0]
      Quartz scheduler 'QuartzScheduler' initialized
info: Quartz.Impl.StdSchedulerFactory[0]
      Quartz scheduler version: 3.2.3.0
info: Quartz.Core.QuartzScheduler[0]
      Scheduler QuartzScheduler_$_NON_CLUSTERED started.
info: Microsoft.Hosting.Lifetime[0]
      Application started. Press Ctrl+C to shut down.
...

At this point you now have Quartz running as a hosted service in your application, but you don't have any jobs for it to run. In the next section, we'll create and register a simple job.

Creating an IJob

For the actual background work we are scheduling, we're just going to use a "hello world" implementation that writes to an ILogger<T> (and hence to the console). You should implement the Quartz.NET interface IJob which contains a single asynchronous Execute() method. Note that we're using dependency injection here to inject the logger into the constructor.

using Microsoft.Extensions.Logging;
using Quartz;
using System.Threading.Tasks;

[DisallowConcurrentExecution]
public class HelloWorldJob : IJob
{
    private readonly ILogger<HelloWorldJob> _logger;
    public HelloWorldJob(ILogger<HelloWorldJob> logger)
    {
        _logger = logger;
    }

    public Task Execute(IJobExecutionContext context)
    {
        _logger.LogInformation("Hello world!");
        return Task.CompletedTask;
    }
}

I also decorated the job with the [DisallowConcurrentExecution] attribute. This attribute prevents Quartz.NET from trying to run the same job concurrently.

Now we've created the job, we need to register it with the DI container along with a trigger.

Configuring the Job

Quartz.NET has some simple schedules for running jobs, but one of the most common approaches is using a Quartz.NET Cron expression. Cron expressions allow complex timer scheduling so you can set rules like "fire every half hour between the hours of 8 am and 10 am, on the 5th and 20th of every month". Just make sure to check the documentation for examples as not all Cron expressions used by different systems are interchangeable.

The following example shows how to register the HelloWorldJob with a trigger that runs every 5 seconds:

public static IHostBuilder CreateHostBuilder(string[] args) =>
    Host.CreateDefaultBuilder(args)
        .ConfigureServices((hostContext, services) =>
        {
            services.AddQuartz(q =>  
            {
                q.UseMicrosoftDependencyInjectionScopedJobFactory();

                // Create a "key" for the job
                var jobKey = new JobKey("HelloWorldJob");

                // Register the job with the DI container
                q.AddJob<HelloWorldJob>(opts => opts.WithIdentity(jobKey));

                // Create a trigger for the job
                q.AddTrigger(opts => opts
                    .ForJob(jobKey) // link to the HelloWorldJob
                    .WithIdentity("HelloWorldJob-trigger") // give the trigger a unique name
                    .WithCronSchedule("0/5 * * * * ?")); // run every 5 seconds

            });
            services.AddQuartzHostedService(q => q.WaitForJobsToComplete = true);
            // ...
        });

In this code we:

  • Create a unique JobKey for the job. This is used to link the job and its trigger together. There are other approaches to link jobs and trigger, but I find this is as good as any.
  • Register the HelloWorldJob with AddJob<T>. This does two things - it adds the HelloWorldJob to the DI container so it can be created, and it registers the job with Quartz internally.
  • Add a trigger to run the job every 5 seconds. We use the JobKey to associate the trigger with a job, and give the trigger a unique name (not necessary for this example, but important if you run quartz in clustered mode, so is best practice). Finally, we set a Cron schedule for the trigger for the job to run every 5 seconds.

And that's it! No more creating a custom IJobFactory or worrying about supporting scoped services. The default package handles all that for you—you can use scoped services in your IJob and they will be disposed when the job finishes.

If you run you run your application now, you'll see the same startup messages as before, and then every 5 seconds you'll see the HelloWorldJob writing to the console:

Background service writing Hello World to console repeatedly

That's all that's required to get up and running, but there's a little too much boilerplate in the ConfigureServices method for adding a job for my liking. It's also unlikely you'll want to hard code the job schedule in your app. If you extract that to configuration, you can use different schedules in each environment, for example.

Extracting the configuration to appsettings.json

At the most basic level, we want to extract the Cron schedule to configuration. For example, you could add the following to appsettings.json:

{
  "Quartz": {
    "HelloWorldJob": "0/5 * * * * ?"
  }
}

You can then easily override the trigger schedule for the HelloWorldJob in different environments.

For ease of registration, we could create an extension method to encapsulate registering an IJob with Quartz, and setting it's trigger schedule. This code is mostly the same as the previous example, but it uses the name of the job as a key into the IConfiguration to load the Cron schedule.

public static class ServiceCollectionQuartzConfiguratorExtensions
{
    public static void AddJobAndTrigger<T>(
        this IServiceCollectionQuartzConfigurator quartz,
        IConfiguration config)
        where T : IJob
    {
        // Use the name of the IJob as the appsettings.json key
        string jobName = typeof(T).Name;

        // Try and load the schedule from configuration
        var configKey = $"Quartz:{jobName}";
        var cronSchedule = config[configKey];

        // Some minor validation
        if (string.IsNullOrEmpty(cronSchedule))
        {
            throw new Exception($"No Quartz.NET Cron schedule found for job in configuration at {configKey}");
        }

        // register the job as before
        var jobKey = new JobKey(jobName);
        quartz.AddJob<T>(opts => opts.WithIdentity(jobKey));

        quartz.AddTrigger(opts => opts
            .ForJob(jobKey)
            .WithIdentity(jobName + "-trigger")
            .WithCronSchedule(cronSchedule)); // use the schedule from configuration
    }
}

Now we can clean up our application's Program.cs to use the extension method:

public class Program
{
    public static void Main(string[] args) => CreateHostBuilder(args).Build().Run();

    public static IHostBuilder CreateHostBuilder(string[] args) =>
        Host.CreateDefaultBuilder(args)
            .ConfigureServices((hostContext, services) =>
            {
                services.AddQuartz(q =>
                {
                    q.UseMicrosoftDependencyInjectionScopedJobFactory();

                    // Register the job, loading the schedule from configuration
                    q.AddJobAndTrigger<HelloWorldJob>(hostContext.Configuration);
                });

                services.AddQuartzHostedService(q => q.WaitForJobsToComplete = true);
            });
}

This is essentially identical to our configuration, but we've made it easier to add new jobs, and move the details of the schedule into configuration. Much better!

Note that although ASP.NET Core allows "on-the-fly" reloading of appsettings.json, this will not change the schedule for a job unless you restart the application. Quartz.NET loads all its configuration on app startup, so will not detect the change.

Running the application again gives the same output: the job writes to the output every 5 seconds.

Background service writing Hello World to console repeatedly

Summary

In this post I introduced Quartz.NET and showed how you can use the new Quartz.Extensions.Hosting library to easily add an ASP.NET Core HostedService which runs the Quartz.NET scheduler. I showed how to implement a simple job with a trigger and how to register that with your application so that the hosted service runs it on a schedule. For more details, see the Quartz.NET documentation. I also discuss Quartz in the second edition of my book, ASP.NET Core in Action.

Using action results and content negotiation with "route-to-code" APIs

$
0
0
Using action results and content negotiation with

In this post post I show that you can combine some techniques from MVC controllers with the new "route-to-code" approach. I show how you can use MVC's automatic content negotiation feature to return XML from a route-to-code endpoint.

What is route-to-code?

"Route-to-code" is a term that's been used by the ASP.NET Core team for the approach of using the endpoint routing feature introduced in ASP.NET Core 3.0 to create simple APIs.

In contrast to the traditional ASP.NET Core approach of creating Web API/MVC controllers, route-to-code is a simpler approach, with fewer features, that puts you closer to the "metal" of a request.

For example, the default Web API template includes a WeatherForecastController looks something like the following:

[ApiController]
[Route("[controller]")]
public class WeatherForecastController : ControllerBase
{
    private readonly ILogger<WeatherForecastController> _logger;
    public WeatherForecastController(ILogger<WeatherForecastController> logger)
    {
        _logger = logger;
    }

    [HttpGet]
    public IEnumerable<WeatherForecast> Get()
    {
        return Enumerable.Empty<WeatherForecast>(); // this normally returns a value.
    }
}

You can see various features of the MVC framework, even in this very basic example:

  • The controller is a separate class which (theoretically) can be unit tested.
  • The route that the Get() endpoint is associated with is inferred using [Route] attributes from the name of the controller.
  • The controller can use Dependency Injection.
  • The [ApiController] attribute applies additional cross-cutting behaviours to the API using the MVC filter pipeline.
  • It's not shown here, but you can use model binding it automatically extract values from the request's body/headers/URL.
  • Returning a C# object from the Get() action method serializes the value using content negotiation.

In contrast, route-to-code endpoints are added directly to your middleware pipeline in Startup.Configure(). For example, we could create a similar endpoint to the previous example using the following:

public class Startup
{
    public void ConfigureServices(IServiceCollection services)
    {
    }

    public void Configure(IApplicationBuilder app)
    {
        app.UseRouting();

        app.UseEndpoints(endpoints =>
        {
            // create a basic endpoint
            endpoints.MapGet("weather", async (HttpContext context) =>
            {
                var forecast = new WeatherForecast
                {
                    Date = DateTime.UtcNow,
                    TemperatureC = 23,
                    Summary = "Warm"
                };

                await context.Response.WriteAsJsonAsync(forecast);
            });
        });
    }
}

This endpoint is similar to the API controller, but it's much more basic:

  • Routing is very explicit. There's no conventions, the endpoint responds to the /weather path and that's it.
  • There's no filter pipeline, constructor DI, or model binding.
  • The response is serialized to JSON using System.Text.Json. There's no content negotiation or serializing to other formats. If you need that functionality, you'd have to implement it manually yourself.

If you're building simple APIs, then this may well be good enough for you. There's far less infrastructure required for route-to-code, which should make them more performant than MVC APIs. As part of that there's generally just less complexity. If that appeals to you, then route-to-code may be a good option.

Filip has a great post on how using new C#9 features in combination with route-to-code to build surprisingly complex APIs with very little code. There's also a great introduction video to route-to-code by Cecil Phillip and Ryan Nowak here.

So route-to-code could be a great option where you want to build something simple or performant. But what if you want the middle ground? What if you want to use some of the MVC features.

Adding content negotiation to route-to-code

One of the useful features of the MVC/Web API framework is that it does content negotiation. Content negotiation is where the framework looks at the the Accept header sent with a request, to see what content type should be returned.

For most APIs these days, the Accept header will likely include JSON, hence why the "just return JSON" approach will generally work well for route-to-code APIs. But what if, for example, the Accept header requires XML?

In MVC, that's easy. As long as you register the XML formatters in Startup.ConfigureServices(), the MVC framework will automatically format requests for XML as XML.

Route-to-code doesn't have any built-in content negotiation. so you have to handle that yourself. In this case, that's probably not too hard, but it's extra boilerplate you must write yourself. If you don't write that code, the endpoint will just return JSON no matter what you request

Image of the API returning JSON when XML was requested

I was interested to find that we have a third option: cheat, and use an MVC ActionResult to perform the content negotiation.

The example below is very similar to the route-to-code sample from before, but instead of directly serializing to JSON, we create an ObjectResult instead. We then execute this result, by providing an artificial ActionContext.

public void Configure(IApplicationBuilder app)
{
    app.UseRouting();

    app.UseEndpoints(endpoints =>
    {
        endpoints.MapGet("weather", async (context) =>
        {
            var forecast = new WeatherForecast
            {
                Date = DateTime.UtcNow,
                TemperatureC = 23,
                Summary = "Warm"
            };

            var result = new ObjectResult(forecast);
            var actionContext = new ActionContext { HttpContext = context };

            await result.ExecuteResultAsync(actionContext);
        });
    });
}

This code is kind of a hybrid. It uses route-to-code to execute the endpoint, but then it ducks back into the MVC world to actually generate a response. That means it uses the MVC implementation of content-negotiation!

In order to use those MVC primitives, we need to add some MVC services to the DI container. We can use the AddMvcCore() extension method to add the services we need, and can add the XML formatters to support our use case:

public class Startup
{
  public void ConfigureServices(IServiceCollection services)
  {
      services.AddMvcCore() 
          .AddXmlSerializerFormatters();
  }

  public void Configure(IApplicationBuilder app)
  {
    // as above
    app.UseRouting();

    app.UseEndpoints(endpoints =>
    {
        endpoints.MapGet("weather", async (context) =>
        {
            var forecast = new WeatherForecast
            {
                Date = DateTime.UtcNow,
                TemperatureC = 23,
                Summary = "Warm"
            };

            var result = new ObjectResult(forecast);
            var actionContext = new ActionContext { HttpContext = context };

            await result.ExecuteResultAsync(actionContext);
        });
    });
  }
}

With this in place, we now have MVC-style content negotiation-when the Accept header is set to application/xml, we get XML, without having to do any further work in our endpoint:

Image of a request for XML returning XML

Be aware that there are many subtleties to MVC's content-negotiation algotithm, such as ignoring the */* value, formatting null as a 204, and using text/plain for string results, as laid out in the documentation.

So now that I've shown that you can do this, should you?

Should you do this?

To prefix this section I'll just say that I've not actually used this approach in anything more than a sample project. I'm not convinced it's very useful at this stage, but it's interesting to see that it's possible!

One of the problems is that calling AddMvcCore(), adds a vast swathe of services to the DI container. This isn't a problem in-and-of itself, but it will slow down your app's startup slightly, and use more memory etc, as you actually register most of the MVC infrastructure. That makes your "lightweight" rout-to-code app a little bit "heavier".

On the plus side, the actual execution of your endpoint stays lightweight. There's still no filters or model binding in use, it's only the final ActionResult execution which uses the MVC infrastructure. And as we're executing the ActionResult directly, there's not many additional layers here either, so that's good.

Actually executing the ActionResult is a bit messy of course, as you need to instantiate the ActionContext. There might be other implications I'm missing here too - you might need to pass in RouteData for example if you're trying to execute a RedirectResult, or some other ActionResult that's more closely tied to the MVC infrastructure.

This is just a proof of concept, but I wonder if it's the sort of thing that we'll see supported more concretely as part of Project Houdini. Exposing the content negotiation capability to route-to-code APIs seems like a very useful possibility, and shouldn't really be tied to MVC. Let's hope 🤞

Summary

In this short post I showed that you can execute MVC ActionResults from a route-to-code API endpoint. This allows you to, for example, use automatic content negotiation to serialize to JSON or XML, as requested in the Accept header. The downside to this approach is that it required registering a lot of MVC services, is generally a bit clunky, and isn't technically supported. While I haven't used this approach myself, it could be useful if you have a limited set of requirements and don't want to use the full MVC framework.

Should I use self-contained or framework-dependent publishing in Docker images?

$
0
0
Should I use self-contained or framework-dependent publishing in Docker images?

ASP.NET Core has two different publishing modes, framework-dependent and self-contained. In this post I compare the impact of the publishing mode on Docker image size. I compare an image published using both approaches and take into account the size of cached layers to decide which approach is the best for Docker images.

I'm only comparing Docker image size in this post, as that's the main thing that changes between the modes. As self-contained mode uses app-trimming it's a little less "safe" as you may accidentally trim assemblies or methods you need. It also takes a little longer to build trimmed self-contained apps, as the SDK has to do the app trimming. For the purposes of this post I'm ignoring those differences.

Framework-dependent vs self-contained

ASP.NET Core apps can be published in one of two modes:

  • Framework-dependent. In this mode, you need to have the .NET Core / .NET 5.0 runtime installed on the target machine.
  • Self-contained. In this mode, your app is bundled with the .NET Core / .NET 5.0 runtime when it is published, so the target machine does not need the .NET Core runtime installed.

There are advantages and disadvantages to both approaches. For example

  • Framework-dependent
    • Pro: you only need to distribute your app's dll files, as the runtime is already installed on the target machine.
    • Pro: you can path the .NET runtime for all your apps, without having to re-compile.
    • Con: you have less control at runtime - you don't know exactly which version of the .NET runtime will be used when your app runs (as it depends what's installed).
  • Self-contained
    • Pro: You have complete control over the runtime used with your app, as you're distributing it with your app.
    • Pro: No requirement for a shared runtime to be installed. This means you can, for example, deploy preview versions of a runtime to Azure App Service, before they're "officially" supported.
    • Con: As you're distributing the runtime as well, the total size of your app will be much larger. This can be mitigated to some extent in .NET 5.0 by using trimming, but your app will still be much larger.
    • Pro/Con: To patch the runtime, you need to recompile and redistribute your app. This is a con, in that it's an extra task to do, but it means that you have always tested your app with a known version of the runtime.
Comparing framework-dependent with self-contained modes

These are pretty standard trade-offs if you're deploying to a hosted service or to to a VM, but what about if you're building Docker images?

Framework-dependent vs self-contained in Docker

If you're building Docker images and publishing these as your "deployment artefact" then the pros and cons aren't as clear cut.

  • Framework-dependent
    • You only need to distribute your app's dll files, as the runtime is already installed on the target machine No longer true, as with a Docker image you're essentially distributing the target machine as well!
    • You don't know exactly which version of the .NET runtime will be used at runtime No longer true as you specify exactly which version of the runtime to use in your Docker image.
  • Self-contained
    • You have complete control over the runtime used with your app, as you're distributing it with your app True, but not really any different to framework-dependent now.
    • No requirement for a shared runtime to be installed True, but again, also true when deploying as a framework dependent app in Docker.
    • To patch the runtime, you need to recompile and redistribute your app True, but again, the same as framework-dependent apps now.
    • As you're distributing the runtime as well, the total size of your app will be much larger. This is no longer true; in both cases we're distributing everything in the Docker image: the OS, the .NET runtime, and the app itself. However, with self-contained deployments we can trim the framework, so we'd expect the resulting Docker images to be smaller.
Comparing framework-dependent with self-contained modes in Docker images

So, based on this, it seems like self-contained deployments for Docker images should be the best approach right? Both images should be functionally the same, and the self-contained deployment is smaller, which is desirable for Docker images, so that makes sense.

However, this ignores an important aspect of Docker images - layer caching. If two Docker images use the same "base" image, then Docker will naturally "de-dupe" the duplicate layers. These duplicate layers don't need to be transferred when pushing or pulling images from registries if the target already has the given layer.

Docker layers don't need to be re-pulled if they already exist on the target machine

If two framework dependent apps are deployed in Docker images, and both use the same framework version, then the effective image size is much smaller, due to the layer caching. In contrast, even though self-contained deployment images will be smaller over all, they'll never benefit from caching the .NET runtime in a layer, as it's part of your application deployment. That means you may well have to push more bytes around with self-contained deployments.

I was interested to put some numbers around this so I setup a little experiment.

Comparing Docker image sizes between framework-dependent and self-contained apps

I decided to do a quick test to put some numbers on the differences between the apps. I wanted to use a vaguely realistic application as a test, so I decided to use the IdentityServer 4 quick-start application as my test

I started by installing the IdentityServer templates using

dotnet new -i IdentityServer4.Templates

And then created my test app called IdentityServerTestApp using:

dotnet new is4ef -n IdentityServerTestApp -o .

The templates currently target .NET Core 3.1, so I quickly updated the target framework to .NET 5.0 for this test. Why not!

Finally I checked I could build using dotnet build. Everything worked, so I moved on to the Docker side.

Creating the test Docker images

Given I want this to be a vaguely realistic test, I created two separate Dockerfiles that use multi-stage builds: one in which the app is deployed in self-contained mode, and one that uses framework-dependent mode.

You should always use multi-stage builds in production, to keep your final Docker images as small as possible. These let you use a different Docker image for the "build" part of your app than you use to deploy it.

The Dockerimage below shows the framework-dependent version. I've just done the whole restore/build/publish in one step here, as I'm only going to be building it once anyway. In practice, you should use an approach that caches intermediate build layers.

# The builder image
FROM mcr.microsoft.com/dotnet/sdk:5.0.100-alpine3.12 AS builder

WORKDIR /sln

# Just copy everything
COPY . .

# Do the restore/publish/build in one step
RUN dotnet publish -c Release -o /sln/artifacts

# The deployment image
FROM mcr.microsoft.com/dotnet/aspnet:5.0.100-alpine3.12

# Copy across the published app
WORKDIR /app
ENTRYPOINT ["dotnet", "IdentityServerTestApp.dll"]
COPY --from=builder ./sln/artifacts .

The self-contained deployment uses a very similar Dockerfile:


# The builder image
FROM mcr.microsoft.com/dotnet/sdk:5.0.100-alpine3.12 AS builder

WORKDIR /sln

# Just copy everything
COPY . .

# Do the restore/publish/build in one step
RUN dotnet publish -c Release -r linux-x64 -o /sln/artifacts -p:PublishTrimmed=True

# The deployment image
FROM mcr.microsoft.com/dotnet/runtime-deps:5.0.100-alpine3.12

# Copy across the published app
WORKDIR /app
ENTRYPOINT ["dotnet", "IdentityServerTestApp.dll"]
COPY --from=builder ./sln/artifacts .

There's only two differences here:

  • We're publishing the app as self-contained by specifying a runtime identifier (linux-x64). I've also set it to do conservative assembly-level trimming, new in .NET 5.0. You could update that to the more aggressive member-level trimming by adding -p:TrimMode=Link
  • Instead of using the dotnet/aspnet image, which has the ASP.NET Core runtime installed, we're using dotnet/runtime-deps, which doesn't have a .NET runtime installed at all.

If we compare the base size of the runtime images, you can see that the dotnet/aspnet image is about 10x larger, 103MB vs. 9.9MB:

> docker images | grep mcr.microsoft.com/dotnet

mcr.microsoft.com/dotnet/sdk            5.0.100-alpine3.12   487MB
mcr.microsoft.com/dotnet/aspnet         5.0.0-alpine3.12     103MB
mcr.microsoft.com/dotnet/runtime-deps   5.0.0-alpine3.12      10MB

This is what we'd expect. The dotnet/aspnet image includes everything in the dotnet/runtime-deps, but then layers the .NET 5.0 runtime and ASP.NET Core framework libraries on top. That layer constitutes the additional 93MB of the image size.

Now lets see what the size difference is once we build and publish our apps.

Building the images

We can build the images using the following two commands:

# Build the framework-dependent app
docker build -f FrameworkDependent.Dockerfile -t identity-server-test-app:framework-dependent .
# Build the self-contained app
docker build -f SelfContained.Dockerfile -t identity-server-test-app:self-contained .

Let's compare the final Docker images after publishing our app:

> docker images | grep identity-server-test-app

identity-server-test-app      framework-dependent   131MB
identity-server-test-app      self-contained        65MB

The table below breaks these numbers down a bit further, to see where the size difference comes from.

I later run another test in self-contained mode with aggressive, member-level, trimming enabled. For the purposes of the table, I assumed that only members from framework dlls were trimmed. That's probably not entirely accurate, but I think is a reasonable assumption here.

Layer Cached? Framework-dependent Self-contained Agressive trimming
Base runtime-dependencies Yes 9.9 MB 9.9MB 9.9MB
Shared framework layer Yes 93 MB - -
Trimmed .NET runtime dlls No - 48MB 27 MB
Application dlls No 28 MB 28 MB 28 MB
Total 131 MB 76 MB 65 MB
Total (excluding cached) 28 MB 66 MB 55 MB

As you can see, the self-contained image is significantly smaller than the framework dependent image 76MB (or 65MB for member-trimming) vs. 131MB. However, if you just consider the "uncacheable" layers in the apps, and assume that the base dependencies and shared framework layers will already be present on target machines (a reasonable enough assumption in many cases), then the results swing the other way!

So which is the "right" option? From my point of view, if you're deploying Docker images to a Kubernetes cluster (for example), then the framework-dependent approach probably makes the most sense. You'll benefit from more layer-caching, so there should be fewer bytes to push to and from Docker registries. If you're unsure if the layers will be cached, if you're deploying to some sort of shared hosting for example, then the smaller self-contained deployments are probably the better option.

I'm only talking about the case where you're deploying in Docker here. If you're not, I think the self-contained deployment will often be the better approach for the added control and assurance it gives you about your runtime environment.

Summary

In this post I compared the size of an example application when deployed in a Docker image using two different modes. Using the framework-dependent publishing mode, the final runtime image was 131 MB, but 103 MB of that would likely already be cached on a target machine.

In contrast, the self-contained deployment model gave images that were 76 MB (or 65 MB with member-level trimming enabled)—significantly smaller. However, only 10MB of those images can be cached, giving a larger size to push and pull from repositories (66MB vs 28MB).

For that reason, I think if you're deploying Docker images to a Kubernetes cluster (for example), then the framework-dependent approach probably makes the most sense. You'll benefit from more layer-caching, so there should be fewer bytes to push to and from Docker registries. If you're unsure if the layers will be cached, if you're deploying to some sort of shared hosting for example, then the smaller self-contained deployments are probably the better option.

Auto-assigning issues using a GitHub Action: Creating my first GitHub app with Probot - Part 4

$
0
0
Auto-assigning issues using a GitHub Action

About 18 months ago, I wrote a GitHub app that would automatically assign any issues raised in a GitHub repository to a specific user using Probot. However, GitHub apps are essentially deprecated at this point, as they've been superseded by GitHub actions.

In this post I show how you can install a GitHub action workflow into your repository that automatically assigns new issues to specific users.

Why do you need this?

Many of the repositories I have in GitHub are small-ish libraries, in which I'm the main (sometimes sole) maintainer. That's fine by me, they're not big enough in scope to need more people working on them. But it means that in general, any issues raised need to be addressed by me.

The trouble is, keeping track of open issues isn't easy. GitHub has its notifications page, but that still doesn't make it easy for me to quickly see all outstanding issues across my repositories. My solution is to automatically assign the issues to me. That way I can use the "assigned" filters in the notifications and issues pages

The assigned issues filter in GitHub

Previously, I wrote a simple GitHub App using Probot and Glitch. This worked well for a time, but it had limitations, required running the app externally (using Glitch) and is using now-obsolete APIs that will soon be deprecated. Luckily, GitHub actions can now fill in the gaps.

Auto-assigning issues using GitHub actions

I'm not going to go into detail about GitHub actions here, but in short, GitHub actions allows you to run code when an event happens in your GitHub repository. One of the most common events is for a push to your repository, so you can use GitHub actions for running continuous integration builds of your application.

In this case, I'm going to configure a GitHub action to run every time an issue is created in my repository. Instead of creating the action myself, I'm going to use an action published in the GitHub marketplace: Auto-assign issue

This issue does exactly what it says on the tin: it assigns new issues to one or more users.

The Auto Assign Issues GitHub action on the marketplace

Adding a new workflow to a repository

Adding a new workflow to a repository just requires creating a .yaml file in the .github/workflows folder in your repository. Alternatively, GitHub provides a UI for adding a new workflow to your application in the browser.

Go to the "Actions" tab in your repository on GitHub. In the example below, for my blog-examples repository, the URL is https://github.com/andrewlock/blog-examples/actions/new:

The default GitHub actions page

Click the link to "set up a workflow yourself". There's also a whole range of started templates available if you're new to setting up CI.

Clicking the link takes you to the workflow editor. This is a simple YAML editor with some basic validation, which should help avoid making the worst mistakes. Choose an appropriate name for the file, for example assign-issue.yml

Create a new GitHub action

If you'd prefer, you can create the file locally and push using a normal Git workflow instead.

Add the following YAML to the workflow, replacing andrewlock with a comma-separated list of GitHub usernames you'd like to be auto-assigned to issues.

name: Issue assignment

on:
  issues:
    types: [opened]

jobs:
  auto-assign:
    runs-on: ubuntu-latest
    steps:
      - name: 'Auto-assign issue'
        uses: pozil/auto-assign-issue@v1
        with:
          repo-token: ${{ secrets.GITHUB_TOKEN }}
          assignees: andrewlock

This workflow uses the open-source pozil/auto-assign-issue action. You can view the source code for this action at https://github.com/pozil/auto-assign-issue. It is a very basic action, but it does everything I want!

Once you're happy, click the "Start Commit" button and optionally add a new commit message and description to commit the file to your Git repository. You can either commit directly to your main branch if your branch policy allows, or you can create a PR to merge it through the normal flows:

Committing the file

That's all there is to it. The new workflow file is created in your GitHub repository, and you can also view it under the Actions tab. Time to take it for a spin!

Testing the auto-assign issue action

This is an easy one to test, simply create a test issue in your repository! When you do, you won't see the issue assigned immediately, but if you check the Actions tab, you'll see that the "Issue assignment" workflow is running:

Workflow in progress

After a few seconds or so, you should see the workflow has turned green. You can click on the workflow to view the details of the workflow. If you click on the name of the workflow file, you can view the logs for the workflow. In this case you can see that the workflow assigned issue 63 to the user andrewlock:

Viewing the logs of the completed workflow

I'm not sure what that Unexpected input(s) warning is about, but it worked fine, so I chose to ignore it!

If we head back to the issue we can see that GitHub actions assigned the issue to me as expected!

Viewing the assigned issue

This whole workflow is much easier to use than the ProBot approach I was using previously, and can allow for some very sophisticated workflows. For now, this does everything I need!

The only downside I've found of actions vs GitHub Apps is that you need to explicitly add this workflow to every repository, instead of installing it "globally" at the account level.

Removing the old app

With the new GitHub action in place, I can now remove the old Probot app I created. Navigate to https://github.com/settings/installations, or click Settings > Applications and click "Configure" next to the app to remove:

Viewing your GitHub app installations

To uninstall the app, scroll down to the bottom of the next page, and click "uninstall". This will uninstall the app from your account.

Uninstalling a GitHub app

And you're all done. The uninstallation will enter a queue, but the app will be removed from your installed apps list soon.

Summary

In this post I described how I replaced a Probot app (deployed to Glitch) for auto-assigning GitHub issues with a GitHub action instead. I used an existing GitHub action from the marketplace to quickly add the same functionality, without requiring me to deploy an app externally.

An introduction to the Data Protection system in ASP.NET Core

$
0
0
An introduction to the Data Protection system in ASP.NET Core

In this post I provide a primer on the ASP.NET Core data-protection system: what it is, why do we need it, and how it works at a high level.

Why do we need the data-protection system?

The data-protection system is a set of cryptography APIs used by ASP.NET Core to encrypt data that must be handled by an untrusted third-party.

The classic example of this is authentication cookies. Cookies are a way of persisting state between requests. You don't want to have to provide your username and password with every request to a server, that would be very arduous!

Instead, you provide your credentials once to the server. The server verifies your details and issues a cookie that says "This is Andrew Lock. He doesn't need to provide any other credentials, trust him". On subsequent requests, you can simply provide that cookie, instead of having to supply credentials. Browsers automatically send cookies with subsequent requests, which is how the web achieves the smooth sign-in experience for users.

Image showing using a cookie to persist the authentication state between requests
Cookies can be used to persist the authentication state between requests

This cookie is a very sensitive item. Any request that includes the cookie will be treated as though it was sent by the original user, just as though they provided their username and password with every request. There are lots of protections in browsers (for example, CORS) to stop attackers getting access to these cookies.

However, it's not just a case of stopping others getting their hand on your cookies. As a website owner, you also don't want users to tamper with their own cookies.

Authentication cookies often contain more than just the ID or name of the user that authenticated. They typically contain a variety of additional claims. Claims are details about the user. They could be facts, such as their name, email, or phonenumber, but they can also be permission-related claims, such as IsAdmin or CanEditPosts.

If you're new to claims-based authentication, I wrote an introduction to authentication and claims several years ago that many people have found useful. Alternatively, see the authentication chapter in my book (shameless plug!).

These claims are typically needed for every request, to determine if the user is allowed to take an action. Instead of having to load these claims from a database with every request, they're typically included in the authentication cookie that's sent to the user.

Image showing a cookie that contains claims
Authentication cookies typically contain claims about the user principal

This makes it easier for the application—once the user is authenticated by extracting the user principal from the cookie, the application will know exactly which claims the user has. That means the application has to trust the cookie. If the cookie was sent in plain-text, then the user could just edit the values, exposing a glaring security hole in the application.

The ASP.NET Core data-protection system is used for exactly this purpose. It encrypts and decrypts sensitive data such as the authentication cookie. By encrypting the authentication cookie before it's returned in the response, the application knows that the cookie has not been tampered with, and can trust its values.

How does the data-protection system work at a high level?

The data-protection system tries to solve a tricky problem: how to protect sensitive data that will be exposed to attackers, ideally without exposing any key material to developers, while following best practices for key-rotation and encryption at rest.

The data-protection system uses symmetric-key encryption to protect data. A key containing random data is used to encrypt the data, and the same key is used to decrypt the data.

Image showing how symmetric encrpytion works
Symmetric encryption from Wikipedia Munkhzaya Ganbold, CC BY-SA 4.0

The ASP.NET Core data-protection system assumes that it will be the same app or application decrypting the data as encrypted it. That implies it has access to the same key, and knows the parameters used to encrypt the data.

In a typical ASP.NET Core application there might be several different types of unrelated data you need to encrypt. For example, in addition to authentication cookies, you might also need to encrypt Cross-Site Request Forgery Tokens (CSRF) or password reset tokens.

You could use the same key for all these different purposes, but that has the potential for issues to creep in. It would be far better if a password reset token couldn't be "accidentally" (more likely, maliciously) used as an authentication token, for example.

The ASP.NET Core data-protection system achieves this goal by using "purposes". The data-protection system has a parent key which can't be used directly. Instead, you must derive child keys from the parent key, and it's those keys which are used to encrypt and decrypt the data.

Image showing deriving child keys from parent using purpose strings
Child keys can be derived by supplying a "purpose" string. You can also derive child keys from other child keys.

Deriving a key from a parent key using the same purpose string will always give the same key material, so you can always decrypt data that was encrypted if you have the parent key and know the purpose string. If a key is derived using a different purpose, then attempting to decrypt the data will fail. That keeps the data isolated which is better for security.

The image above also shows that you can derive child keys from a child key. This can be useful in some multi-tenant scenarios for example. There's no special relationship between the child and grand-child keys—neither can read data encrypted with the other key. You can read the gory details about key derivation here.

In most cases you won't have to interact with the data-protection system directly to create keys or encrypt data. That's handled by the core ASP.NET Core framework and the accompanying libraries. They make sure to use unique strings for each different purpose in your application. You can create your own protectors and encrypt other data if you wish (see below), but that's not required for day-to-day running of ASP.NET Core applications.

I'm a .NET Framework developer—this sounds a lot like <machineKey>?

The data-protection system is new to ASP.NET Core, but the need to protect authentication tokens isn't new, so what were we using before? The answer is <machineKey>.

The <machineKey> element was used in much the same way as the ASP.NET Core data-protection system, to configure the keys and cryptography suite used to encrypt data by the authentication system (among other places). Unfortunately there were some complexities in using this key as it was typically read from the machine.config, would have to be configured on the machine running your application. When running in a cluster, you'd have to make sure to keep these keys in sync which could be problematic!

The need to keep keys in sync doesn't change with the data-protection system, it's just a lot easier to do, as you'll see shortly.

In .NET Framework 4.5 we got the ability to replace the <machineKey> element and the whole cryptography pipeline it uses. That means you can actually replace the default <machineKey> functionality with the new ASP.NET Core data-protection system, as long as you're running .NET Framework 4.5.1. You can read how to do that in the documentation.

Warning: If you're migrating ASP.NET applications to ASP.NET Core, and are sharing authentication cookies, you'll need to make sure you do this, so that authentication cookies can continue to be decrypted by all your applications.

I won't go any more into <machineKey> here, partly because that's the old approach, and partly because I don't know much about it! Needless to say, many of the challenges with managing the <machineKey> have been addressed in the newer data-protection system.

How is the data protection key managed? Do I need to rotate it manually?

If you know anything about security, you're probably used to hearing that you should regularly rotate passwords, secrets, and certificates. This can go some way to reducing the impact if one of your secrets is compromised. That's why HTTPS certificates are gradually being issued with smaller and smaller lifetimes.

How often the best-practice of secret-rotation is actually done is another question entirely. Depending on the support you get from your framework and tools, rotating secrets and certificates can be painful, especially in that transition period, where you may have to support both old and new secrets.

Given that the data-protection keys are critical for securing your ASP.NET Core applications, you won't be surprised that key rotation is the default for the data-protection system. By default, data-protection keys have a lifetime of 90 days, but you generally don't have to worry about that yourself. The data-protection system automatically creates new keys when old keys are near to expiration. The collection of all the available keys is called the key ring.

Image of the data-protection system rotating keys when old ones expire
The data-protection system manages key rotation internally, creating new keys when old ones expire.

I won't go into the details of key management in this post. Just be aware that key rotation happens automatically, and as long as you don't delete any old keys (or explicitly revoke them), then encrypted data can still be retrieved using an expired key. Expired keys aren't used for encrypting new data.

Can I protect other data too or is it just for authentication cookies?

The data-protection system is used implicitly by ASP.NET Core to handle encryption and decryption of authentication tokens. It's also used by the ASP.NET Core Identity UI to protect password reset and MFA tokens. You don't need to do anything for this protection—the framework handles the protection itself.

If you have your own temporary data that you want to encrypt, you can use the data-protection APIs directly. I'll go into more detail in a later post, but the quick example below taken from the docs shows how you can use the IDataProtectionProvider service (registered by default in ASP.NET Core apps) to encrypt and decrypt some data:

 public class MyClass
{
    // The IDataProtectionProvider is registered by default in ASP.NET Core
    readonly IDataProtectionProvider _rootProvider;
    public MyClass(IDataProtectionProvider rootProvider)
    {
        _rootProvider = rootProvider;
    }

    public void RunSample()
    {
        // Create a child key using the purpose string
        string purpose = "Contoso.MyClass.v1";
        IDataProtector protector = provider.CreateProtector(purpose);

        // Get the data to protect
        Console.Write("Enter input: ");
        string input = Console.ReadLine();
        // Enter input: Hello world!

        // protect the payload
        string protectedPayload = _protector.Protect(input);
        Console.WriteLine($"Protect returned: {protectedPayload}");
        //PRINTS: Protect returned: CfDJ8ICcgQwZZhlAlTZT...OdfH66i1PnGmpCR5e441xQ

        // unprotect the payload
        string unprotectedPayload = _protector.Unprotect(protectedPayload);
        Console.WriteLine($"Unprotect returned: {unprotectedPayload}");
        //PRINTS: Unprotect returned: Hello world
    }
}

Generally speaking though, this isn't something you'll want to do. I've personally only needed it when dealing with password reset and similar tokens, as mentioned previously.

Is there anything I shouldn't use data protection for?

An important point is that the data-protection system isn't really intended for general-purpose encryption. It's expected that you'll be encrypting things which, by their nature, have a limited lifetime, like authentication tokens and password reset tokens.

Warning: Don't use the data-protection system for long-term encryption. The data-protection keys are designed to expire and be rotated. Additionally, if keys are deleted (not recommended) then encrypted data will be permanently lost.

Theoretically, you could use the data-protection system for data that you wish to encrypt and store long-term, in a database for example. The data-protection keys expire every 90 days (by default), but you can still decrypt data with an expired key.

The real danger comes if the data-protection keys get deleted for some reason. This isn't recommended, but accidents happen. When used correctly, the impact of deleting data-protection keys on most applications would be relatively minor—users would have to log-in again, password reset keys previously issued would be invalid—annoying, but not a disaster.

If, on the other hand, you've encrypted sensitive data with the data-protection system and then stored that in the database, you have a big problem. That data is gone, destroyed. It's definitely not worth taking that risk! Instead you should probably use the dedicated encryption libraries in .NET Core, along with specific certificates or keys created for that purpose.

How do I configure data-protection in my ASP.NET Core application?

This is where the rubber really meets the road. Typically the only place you'll interact with the data-protection system is when you're configuring it, and if you don't configure it correctly you could expose yourself to security holes or not be able to decrypt your authentication cookies.

On the one hand, the data-protection system needs to be easy to configure and maintain, as complexity and maintenance overhead typically lead to bugs or poor practices. But ASP.NET Core also needs to run in a wide variety of environments: on Windows, Linux, macOS; in Azure, AWS, or on premises; on high end servers and a Raspberry Pi. Each of those platforms has different built-in cryptography mechanisms and features available, and .NET Core needs to be safe on all of them.

To work around this, the data-protection system uses a common "plugin" style architecture. There are basically two different pluggable areas:

  • Key ring persistence Location: Where should the keys be stored?
  • Persistence encryption: Should the keys be encrypted at rest, and if so how.

ASP.NET Core tries to to set these to sensible options by default. For example on a Windows (non-Azure App) machine, the keys will be persisted to %LOCALAPPDATA%\ASP.NET\DataProtection-Keys and encrypted at rest.

Unfortunately, most of the defaults won't work for you once you start running your application in production and scaling up your applications. Instead, you'll likely need to take a look at one of the alternative configuration approaches.

Summary

In this post I provided a high-level overview of ASP.NET Core's data protection system. I described the motivation for the data-protection system—transient, symmetric, encryption—and some of the design principles behind it. I described the system at a high level, with a master key that is used to derive child keys using "purpose" strings.

Next I described how the data-protection system is analogous to the <machineKey> in .NET Framework apps. In fact, there's a <machineKey> plugin, which allows you to use the ASP.NET Core data-protection system in your .NET Framework ASP.NET apps.

Finally, I discussed key rotation and persistence. This is a key feature of the data protection system, and is the main area on which you need to focus when configuring your application. Expired keys can be used to decrypt existing data, but they can't be used to encrypt new data. If you're running your application in a clustered scenario, you'll want to take a look at one of the alternative configuration approaches

Viewing all 743 articles
Browse latest View live